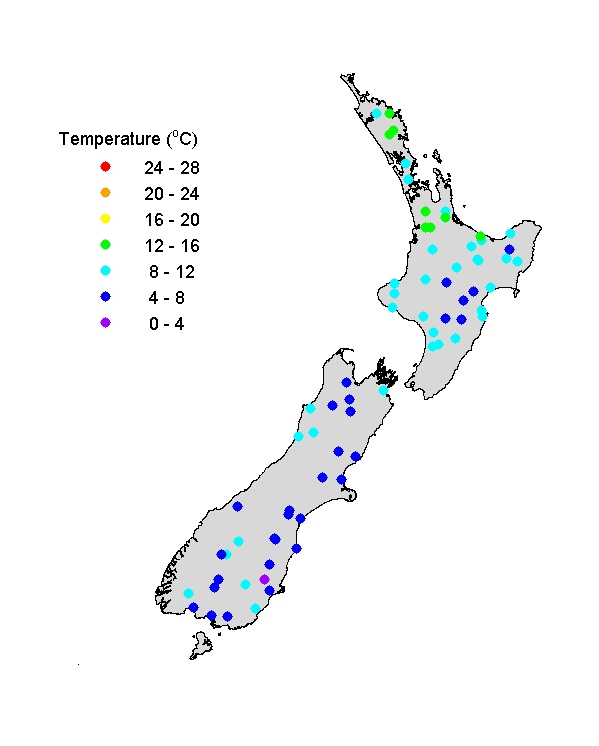
River water temperatures (JAS)
Winter river water temperatures were mostly in the range 4-12oC in both islands and a little higher in the north of North Island. (Data are missing for rivers in Wellington region.) There is the usual weak trend of decreasing temperature moving south (increasingly latitude), and a stronger trend of decreasing temperature with increasing altitude (moving into mountainous areas). The temperature anomaly map shows that river temperatures were normal or about a degree higher than normal for winter over most of the country, although rivers in East Cape, North Island, were unusually cool.
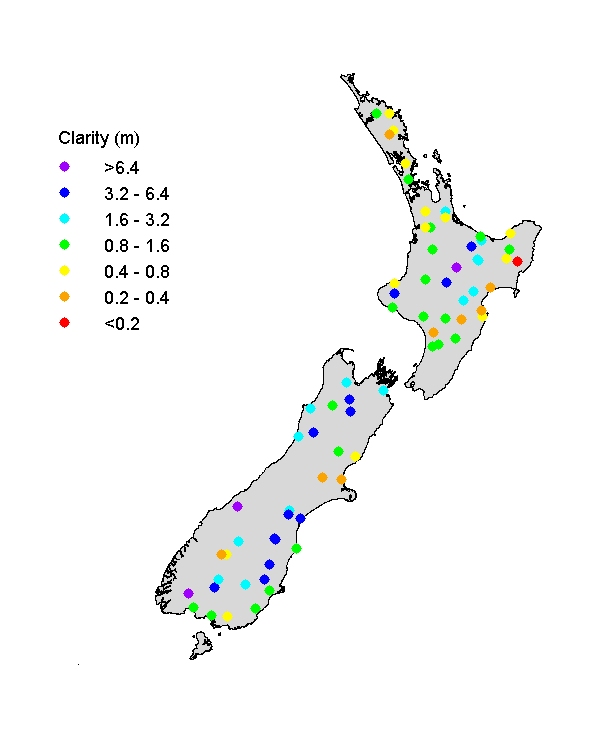
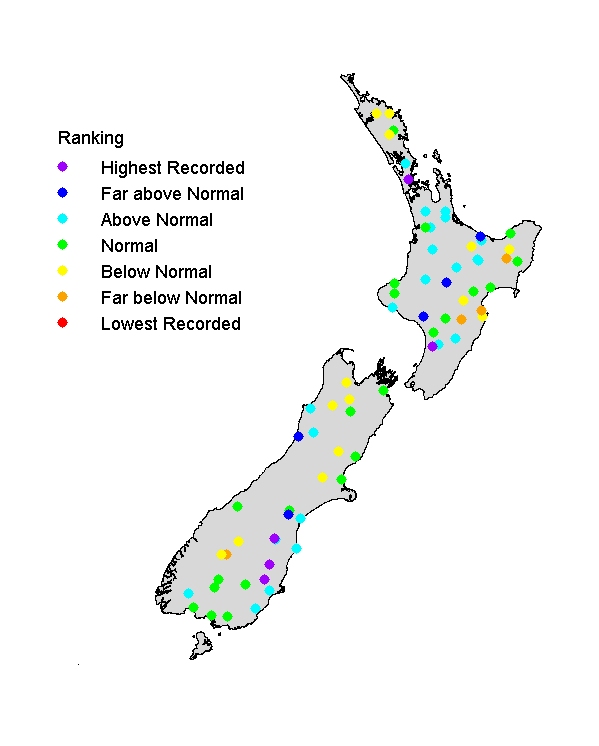
Visual clarity of rivers (JAS)
Visual clarity of New Zealand rivers ranged widely (from <0.2m to >6m) over winter – reflecting the wide range of soil types interacting with vegetation cover. (Data are missing for rivers in Wellington region.) The clarity ranking map shows that many rivers deviated appreciably from typical visual clarity. There was little regional pattern, although eastern North Island rivers tended to be rather turbid. The departures from normality apparently reflect flow conditions during monitoring visits, since rivers are comparatively clear at low flow and turbid at high flow.