New Zealand’s freshwater resources are under increasing pressure. NIWA has investigated how differences in implementation of minimum flow and allocation rate limits can lead to vastly different outcomes for both water users and the downstream flow regime
Abstraction of water from streams and rivers for agricultural and industrial use or power production is increasing globally. In some regions of New Zealand, there is high demand for multiple abstractions for irrigation purposes. However, as pressure on water resources increases, there is growing recognition of a responsibility to maintain river flows to protect ecological functions or values, and to maintain downstream security of human water use.
Many countries have legislated in an attempt to balance the needs of potential users of water for industrial, agricultural or consumptive purposes against environmental needs to sustain ecological states or services. The establishment of water resource use limits for quality and quantity across all of New Zealand’s rivers has recently become a statutory requirement. It is intended that these water resource use limits will avoid over-allocation of water and provide clarity on environmental protection levels and water availability.
For flowing water, quantity limits must be set for freshwater management units and must comprise at least a minimum flow (the flow below which no further water is to be taken) and an allocation rate (the maximum rate of abstraction). A freshwater management unit is any water body or bodies determined as the appropriate scale for setting freshwater objectives and limits for freshwater accounting and management.
Exactly how these limits are implemented is one challenge now facing regional authorities in New Zealand. For example, what is the appropriate scale for setting limits within management units and is this the same scale at which compliance is assessed?
NIWA has explored how, once rules to define a minimum flow and an allocation rate have been established, differences in implementation of these limits can lead to vastly different outcomes for both water users and the downstream flow regime.
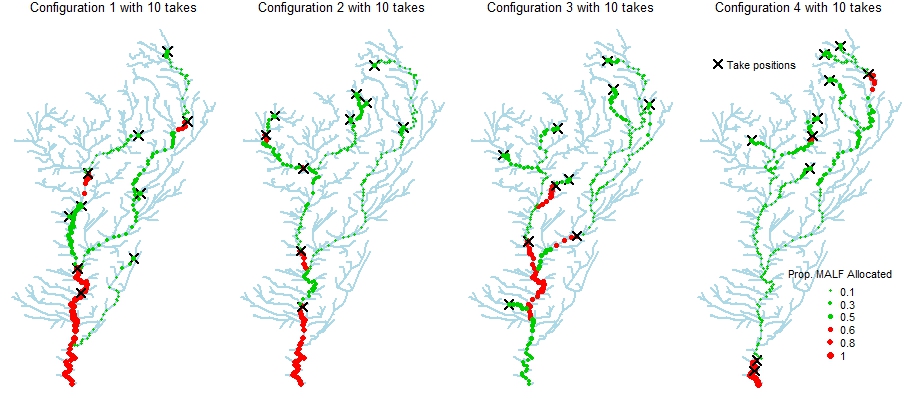
The effects of changes in the number, spatial configuration and strategy for implementing water resource use limits are explored by modelling sets of hypothetical water takes across an example catchment (Figure 1). Results indicate that, due to cumulative effects of multiple takes and the connected nature of river networks, some implementation strategies can ensure that particular limits are met at a downstream monitoring point but may not guarantee that these limits are complied with elsewhere in the catchment.
A strategy for guaranteeing that limits are met at all locations across a catchment is proposed in the study. Practical barriers to applying this strategy, such as legal precedent and the inability to alter existing water consents, are also discussed.