Monitoring water quality and aquatic biota can actively engage communities with their local streams, but is that where the benefits end?
Monitoring water quality and aquatic biota actively engages communities with their local streams. Group members, and the wider community, learn to value freshwaters and understand the impacts on them in new ways. Such engagement is becoming increasingly important, as the New Zealand Government’s recent freshwater reforms encourage greater stakeholder involvement in freshwater planning.
But is monitoring useful only for education, or are the gathered data useful for empowering communities to engage in freshwater planning? And could the data be used, formally or informally, to extend regional authority monitoring networks both temporally and spatially?
At present, stream data collected by volunteer groups is often perceived to lack the robustness and quality of data acquired by professional agencies such as government research institutes and regional councils. But overseas research suggests that community monitoring can be robust and useful if volunteer monitors have ongoing professional support.
NIWA is investigating the ‘concordance’, or similarity, between community monitoring data and ‘professional’ State of Environment data, (obtained by regional councils). Monitoring at nine stream sites (Figure 1) was undertaken at the same location and same time by both regional council staff and community volunteers (Figures 2 and 3), beginning in late summer 2014.
Prior to starting, all community groups were given training by professionals on methods to measure water quality, habitat quality and aquatic biota (macroinvertebrates and periphyton) using inexpensive, commonly available field equipment. Water quality variables and periphyton were measured monthly, whereas habitat quality and macroinvertebrate surveys were undertaken six-monthly (summer and winter).
Halfway through the study, interim results indicate that some variables collected by the community groups closely match those collected by professionals, whereas others did not accurately characterise condition.
Variables that were closest to those collected by the councils included water temperature (Figure 4, Table 1), visual water clarity, conductivity and the faecal indicator E. coli. Variables less consistently collected by the community groups included measures of the particulate nutrients phosphate and nitrate, pH and the amount of dissolved oxygen (Figure 5, Table 1) in the water.
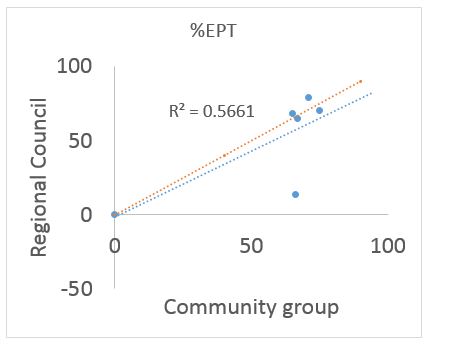
Ecological health assessments, as indicated by the proportion of pollution-sensitive invertebrates coming from the mayfly, stonefly and caddisfly families (%EPT), were similar to the regional council data (Figure. 6, Table 1), as were (but to a lesser extent) overall site invertebrate sensitivity scores based on types collected (i.e., the Macroinvertebrate Community Index; MCI). The quantitative version of the same index (QMCI) less accurately indicated stream health, only prescribing 29 per cent of sites to the same degradation categories as the regional council data.
The Stream Health Monitoring Assessment Kit (SHMAK), developed by NIWA in the late 90s, was used as the basis for equipping community groups, but with pilot ‘extensions’ to include dissolved nutrient and oxygen kits, ‘professional’ quality black disc visual clarity equipment, and Petrifilm ® plates for measuring the faecal bacterial indicator, E. coli. The study will help with the redevelopment, upgrading and extension of the kit.
Interim results indicate high concordance for some of the measured variables. These measurements have the ability to distinguish healthy sites from unhealthy sites, and the successful involvement by community groups opens the opportunity for them to extend the monitoring capacity of regional councils.
The lower concordance for other variables indicates community groups may require further training or higher quality equipment for undertaking the measurements.
This study demonstrates that individuals in the community groups have increased their knowledge of stream and river health, and how to measure it, which will contribute to advancing community engagement in freshwater management in New Zealand.
Table 1: Relationships between variables collected by community groups and regional councils and whether they do or do not accurately capture stream condition (yes or no). Values in brackets are 1. R2 values showing how strong the relationship between the community group and the council was (0 = no relationship, 1 = perfect relationship) and 2. percentage of sites grouped into the same degradation category for invertebrate sensitivity assessment. % EPT = proportion of Ephemeroptera, Plecotera, Trichoptera (mayfly, stonefly, caddisfly) taxa present. MCI = macroinvertebrate community index, QMCI = quantitative macroinvertebrate community index.
|
Yes |
No |
|
Temperature (0.92) |
Phosphate (0.02) |
|
Clarity (0.97) |
Nitrate (0.39) |
|
Conductivity (0.99) |
pH (0.42) |
|
E. Coli (0.82) |
DO (0.07) |
|
% EPT abundance (0.98) |
QMCI (0.36, 29%) |
|
MCI (0.43, 71%) |
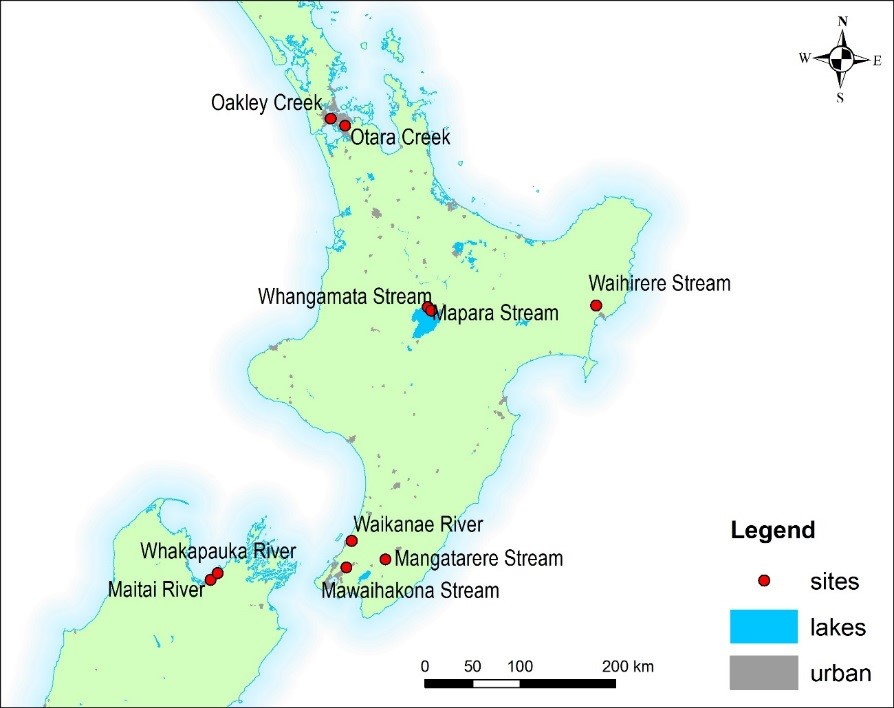 Location of the study sites.
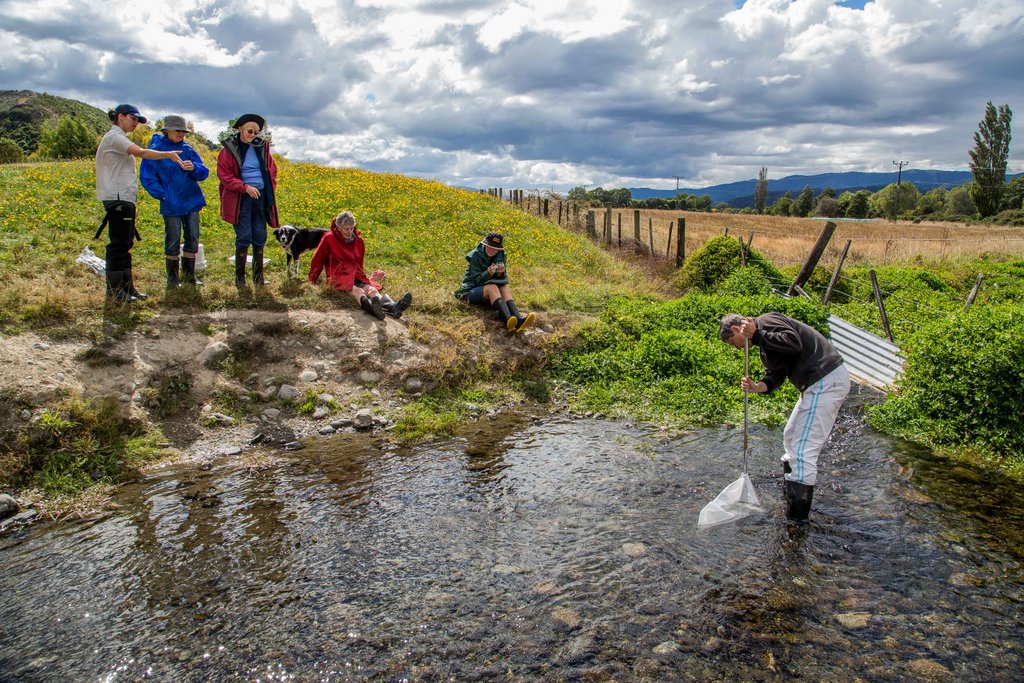
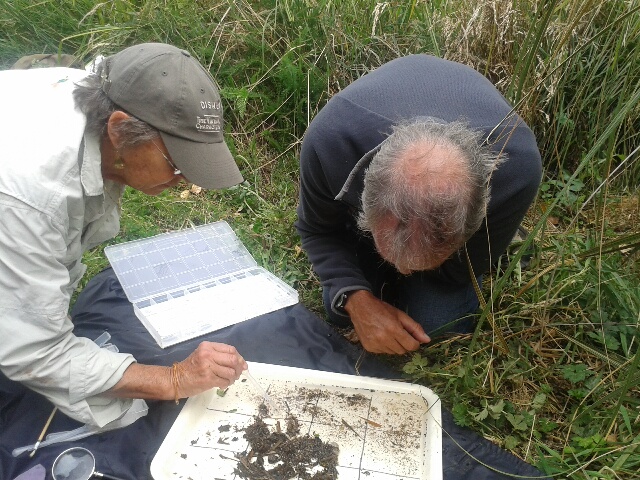
The Mawaihakona Stream community group using a kick-net to sample macroinvertebrates. Photo by Kathryn Hicks. The Taupo group picking invertebrates from a tray to identify then calculate indices of stream health. Photo: Shirley Fraser.
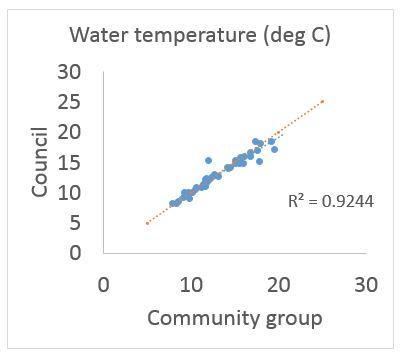
Graph showing the strong relationship between water temperature data collected by the regional council and the community group. R2 value shows the strength of this relationship (0 = no relationship, 1.0 = perfect relationship). The blue dotted line shows the linear trend whereas the red shows the 1:1 relationship.
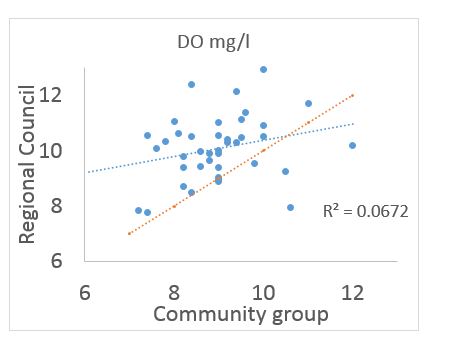
Graph showing the weak relationship between water dissolved oxygen data collected by the regional council and the community group. R2 value shows the strength of this relationship (0 = no relationship, 1.0 = perfect relationship). The blue dotted line shows the linear trend whereas the red shows the 1:1 relationship.