PDF of this article (495 KB)
Lionel Carter Andrew Laing Rob Bell
Occasionally huge storms from the south take us by surprise. Where do they come from and what are their characteristics?
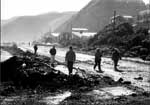
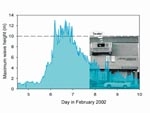
If you were inland on Waitangi Day 2002, you would have missed some of the largest waves to visit central New Zealand in over 25 years. Blue skies and a stiff breeze gave little hint of the giant waves battering Wellington’s south coast. While an undeniable headache for ferry passengers, yacht owners, and workers who repaired coastal damage, the Waitangi event was a spectacular example of wave power formed by storms far from New Zealand.
Distant storms, local waves
Oceanographers have long known that waves formed by large storms can travel great distances. In a classic experiment in 1963 a group of wave experts, including the eminent Wellington scientist Norman Barber, set up wave recording sites that extended across the Pacific Ocean from New Zealand to Alaska. For two-and-a-half months of the Austral winter, the scientists tracked the passage of storm waves that formed around Antarctica to New Zealand, Samoa, Hawaii, California, and finally to Alaska – a total journey of over 14,000 km. Thus, in one of Nature’s quirks, storm waves formed in an Antarctic winter became the summer waves that powered the surfers off California. This simple but elegant experiment captured the hearts of the locals. The New Zealand monitoring site was Cape Palliser, where the lighthouse operator helped moor the instruments in understated “trying conditions”. In Samoa, the High Chief Satele not only provided accommodation, but tended the instruments for the last two weeks of the experiment.
Waitangi Day storm
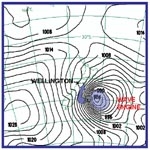
Around mid-day on 5 February 2002, a recording buoy off Baring Head, Wellington, bobbed gently in seas with waves about 1 m high. Just 15 hours later, on Waitangi Day morning, waves reached 13 m, and fluctuated between 10 and 12 m for the rest of the day. A more representative measure – the significant wave height (or highest one third of the waves) – exceeded 8 m. Following this peak, the seas declined slowly and took a full four days to return to their pre-storm condition. The culprit behind the giant seas was an intense depression, centred 800 km southeast of Wellington. This wind and wave generator moved only slowly eastward, all the while creating large waves that travelled straight to central New Zealand and into Cook Strait. As waves approached Wellington, they began to stir sand on the seabed in water depths down to 150 m. Marine organisms living in the sand were caught up in the turbulence. At Island Bay, waves began to break about 5 km offshore and turned the bay into a foam bath. As the tide rose, waves encroached farther inshore to scour unprotected sectors of the coast. Rubble and seaweed covered coastal roads.
Nothing is new
Both the south and west coasts of Wellington have experienced large waves from distant storms before – and will again in the future. One of the damaging events in recent years was the Kapiti storm of 11–13 September 1976. For three days, a large stationary depression near Stewart Island pumped out wind and waves that travelled over 1000 km to crash into the west coast of the North Island. Along the south Taranaki–Kapiti coast, winds and changes in barometric pressure produced a storm surge of 0.7 m. This extra rise in sea level allowed the waves to break farther up the beach. The effects were devastating: over 6 m of coast was eroded at Waikanae, while Raumati lost up to 11 m of beach front, including some houses. Because the piled-up water had to go somewhere, powerful rip and along-shore currents formed to shift the eroded sand south towards Cook Strait.
Waitangi 2002 vs Wahine
The violent storm that sank the inter-island ferry Wahine on 10 April 1968 has become the benchmark by which Wellingtonians judge all other storms. So how does the Waitangi 2002 event compare?
Certainly, the circumstances of the waves were quite different. “Waitangi” waves formed far out in the south-west Pacific, whereas Wahine seas blew up in the southern approaches to Cook Strait. Average “Waitangi” winds were under 55 km/hour, but Wahine winds exceeded 110 km/hour for 6 hours and peaked at 200 km/hour, well above hurricane force. This ferocious wind, coupled with a sharp drop in barometric pressure, caused Wellington Harbour waters to surge nearly 1 m above the predicted tide. “Waitangi” had no comparable surge.
Although weather and tides were measured during the Wahine storm, waves were not. However, we can estimate wave height using a combination of wind speed, duration and fetch – the distance of open ocean affected by the wind. Using computer models to simulate the storm conditions, it is estimated that Wahine waves had maximum and significant wave heights similar to their “Waitangi” counterparts.
When can we expect the next “Big Wave” event?
The short answer is “we don’t know”. At the south coast of the North Island, Wahine arrived in 1968, an unnamed storm with 12-m-high waves struck Wellington in 1989, and in 2002 there was the Waitangi Day event. Just three events spaced 13–21 years apart – hardly enough to make a reliable prediction!
However, just two months after Waitangi Day, central New Zealand was again battered by waves from another distant storm centre. It was “Waitangi” all over again: large waves forced cancellation of inter-island ferries, encouraged shoreline erosion and closed coastal roads. The challenge is to identify the climatic and oceanographic conditions creating this procession of southerlies. That knowledge, together with local wave measurements such as those that have been collected off Baring Head for the past six years, will make us better prepared for the next big surf.
Teachers: this article can be used for Making Sense of Planet Earth and Beyond L4 A.O. 1. See other curriculum connections at www.niwa.co.nz/pubs/wa/resources
Lionel Carter and Andrew Laing are based at NIWA in Wellington; Rob Bell is at NIWA in Hamilton.
