Mapping the trickle

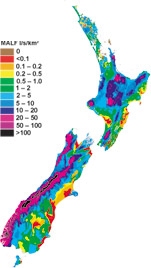
NIWA has just produced maps showing the average annual low flow for rivers and streams throughout New Zealand.
Low flow information is essential to the allocation of water resources, especially in small streams, because the ecosystems are often sensitive to further drops in the water flow. The maps will interest anyone involved in water resource consents, including irrigators, power companies, and regional councils.
In times of low flow, water is being released into the stream from rocks and soil rather than directly from rainfall. This means that any realistic representation of low flow must take into account the physical characteristics of the catchment. To produce maps of average annual low flow for all of New Zealand, we combined six new maps of climate and hydrology data. These new maps capture the best available interpretations of: average rain and number of rain days in the dry season; mean runoff; mean runoff at the start of the dry season; and two interpretations of catchment physical properties (vegetation, geology, soils) that relate to low flow behaviour. As a result, the new estimates of low flow are more detailed and have less bias and standard error than any existing national information.
The maps show information for every reach of stream or river in the River Environment Classification network.
