Nitrogen is a key nutrient element for aquatic plants, similar to terrestrial plants. Nitrogen, along with phosphorus, is routinely measured in waters to test their nutrient status and the likely promotion of nuisance plants or algal growths.
Dissolved inorganic nutrients are immediately available to plants and algae, whereas other forms of nitrogen and phosphorus, although not immediately available, may become available to plants once bacterial action has released the nutrient. Unfortunately, total nitrogen is measured (on unfiltered water) by two different methods in New Zealand by different regional councils and other agencies doing regular water testing. One method, denoted TN-A, is recommended in reports to the Ministry for the Environment arising from the National Environmental Monitoring and Reporting (NEMaR) project, because it is a direct measurement that is better for low level nitrogen. However, many regional councils have historically used another method, denoted TN-K, which involves separate measurement of reduced nitrogen (organic nitrogen plus ammonia) and oxidised nitrogen, then summing these two measurements to estimate total nitrogen. Recently the United States Geological Survey (USGS) reported that TN-A is typically less than TN-K (by an average of about 7%) and the discrepancy gets worse when the suspended solids content of waters increases – apparently because of a low bias in TN-A. This is expected to cause major difficulties with summarising total nitrogen data for rivers and lakes across the whole of New Zealand in national state-of-environment (SoE) reporting. For dissolved nutrient analysis, the NEMaR project recommended laboratory filtering as preferable to field filtering of water samples for dissolved nutrient analyses. Field filtering has the theoretical advantage of virtually sterilising water samples by bacterial removal, which should arrest any biochemical action that could alter nutrient status. However, field conditions are seldom ideal for filtering and field teams may be time-pressured to stay on the pre-ordained sampling schedule (and meet courier deadlines for sample freight). Furthermore, the NEMaR project recommended increased precision in dissolved nutrient measurements to aid detection of trends over time. Before implementing the NEMaR recommendations for nutrient monitoring in waters, Greater Wellington Regional Council (GWRC) carried out paired nutrient method trials on samples from their 55 river SoE sites, with analysis by Hill Laboratories. The trials were as follows:
- Measurement of total nitrogen as TN-A versus TN-K (12 months from July 2013 to June 2014 incl.)
- Laboratory versus field filtering of water samples for soluble inorganic nutrient analysis, (6 months, from July 2013 to December 2013), and
- Adoption of lower detection limits for nutrient analyses to aid temporal trend detection (6 months, from January 2014 to June 2014).
A report in progress (Davies-Colley and McBride 2015 in prep.) analysed the GWRC datasets with a view to informing national policy on nutrient testing Results were reported in two ‘companion’ presentations at the Water Symposium in Blenheim on 27 November 2014 (Milne et al. 2014; Robinson et al., 2014). In rivers of the Wellington Region TN-A tended to be slightly less than TN-K. This was consistent with findings of the USGS on rivers in the USA. However, the discrepancy increased sharply in sediment-laden water samples (TSS >10 mg/L), and the ratio TN-A/TN-K was as low as 16% in a very turbid river sample – apparently due to negative interference of suspended matter on the persulphate digestion. A laboratory experiment at Hill Laboratories showed that on filtered samples, TN-A agreed well with TN-K, showing that it is indeed the suspended particulate matter that causes the low-bias of TN-A.
This interference by river suspended particulate matter in the Wellington Region seems to be much more severe than reported by the USGS for rivers across the USA. These results suggest that changing from the historical method (TN-K) to the direct measurement (TN-A) will present particular difficulties for tracking total nitrogen trends in turbid waters such as flooded rivers or shallow wind-disturbed lakes prone to sediment re-suspension. Accordingly, Davies-Colley & McBride (2015 in prep.) concluded -
- Total nitrogen should always be clearly identified as TN-A or TN-K in summary datasets.
- Regional councils should continue with their historical method of analysis (whether TN-A or TN-K) so as to avoid any step-change that would confound time-trend analysis.
- Total nitrogen data will need to be converted to a common basis (either all to TN-A or all to TN-K) for national summaries of state.
A parallel trial comparing field versus laboratory filtering of river water samples was carried out for 6 months in the second half of 2013. Overall, field and laboratory-filtered analyses agreed closely, and GWRC made the decision to use only laboratory filtering thereafter because of the advantages this provides, particularly at low (trace) levels. In analysing the paired dataset, Davies-Colley & McBride (2015 in prep.) reiterates the importance of prompt and effective chilling of water samples after collection in order to arrest microbial action (notably uptake of some nutrients) during (overnight) freight to the laboratory. This is expected to be even more important for laboratory-filtered than field-filtered (and virtually sterile) water samples At GWRC’s request, Hill Laboratories have been developing methods for measuring dissolved inorganic nutrients to lower detection limits than previously. Fortunately the new methods, denoted ‘trace’ methods (with unchanged chemistry), compare well with the previous ‘screen’ methods, so there is no reason to expect a trend-confounding step-change with adoption of the new, more sensitive, methods in routine SoE work going forward.
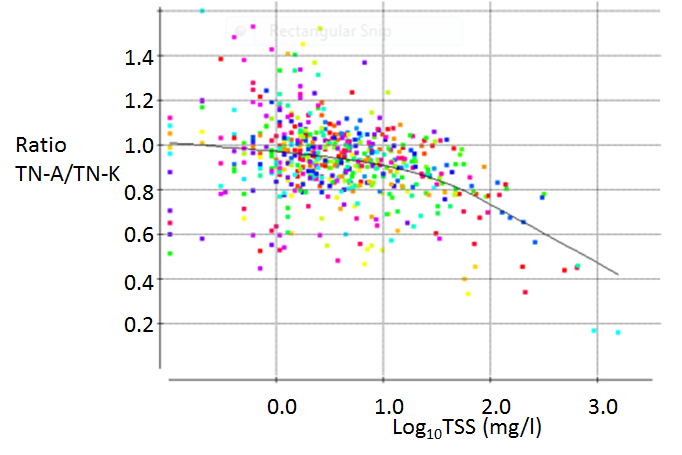
The ratio of TN-A to TN-K plotted against (log-transformed) TSS for 55 river sites in the Wellington Region each sampled monthly for 12 months. Different rivers are plotted with different colours. A LOWESS smoother (convex-up curve) shows the trend of the ratio with total suspended solids (TSS). The ratio of TN-A to TN-K is lowest for the Awhea River at Tora Road (two points on bottom right) at which TN-A was only 16% of TN-K on 27 November and 17% on 30 September, 2013 (with TSS close to 1000 mg/l on both occasions).
References: