-
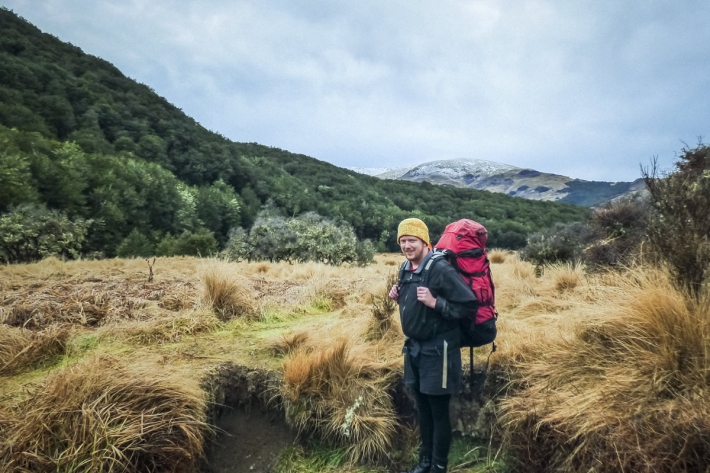
Profile: Wills Dobson - small town, huge horizons
Feature story05 October 2017If it wasn't for a damaged shoulder, Wills Dobson wouldn't be launching weather balloons or fixing high-precision atmospheric measuring instruments. -

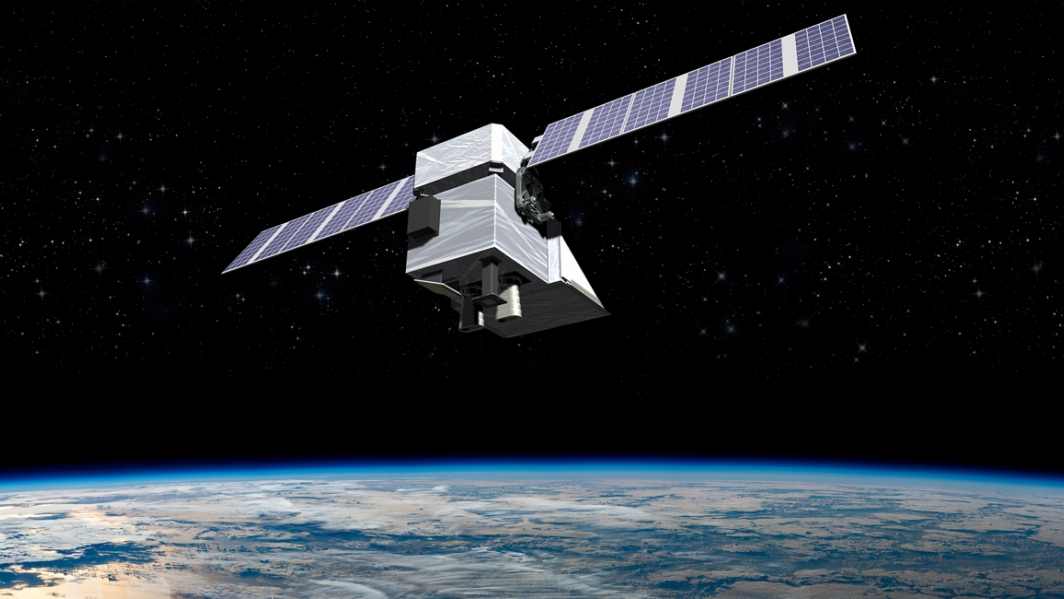
Tiny air bubbles reveal new information about greenhouse gas emissions
Media release24 August 2017Sitting at the surface of Taylor Glacier in Antarctica, are layers of ice more than 10,000 years old. And trapped inside those layers are bubbles of ancient air – like tiny time capsules - able to tell scientists a story about what the world used to be like and how humans have changed it. -
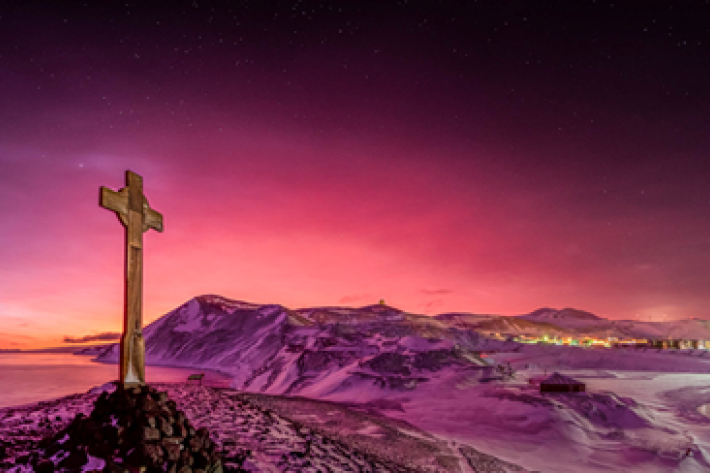
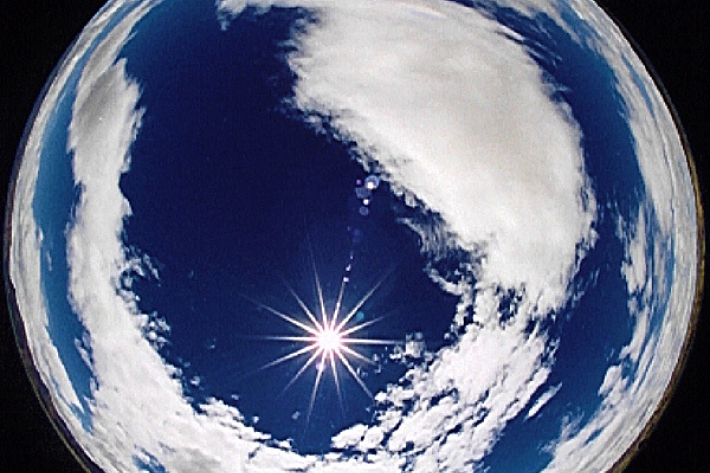
Tonga volcano “afterglow” causes dazzling skies in Antarctica
Media release06 June 2017Antarctica is experiencing stunning skyscapes like those recently seen in New Zealand, thanks to the afterglow effect from the Tongan volcano. -
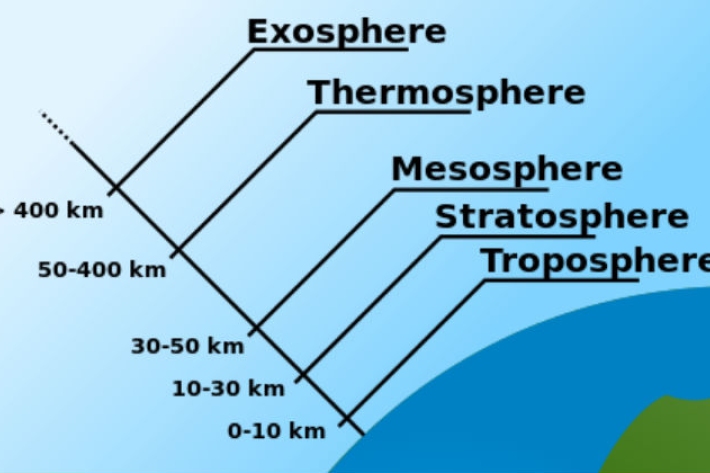
Layers of the atmosphere
Education ResourceThe atmosphere is comprised of layers based on temperature. These layers are the troposphere, stratosphere, mesosphere and thermosphere. -
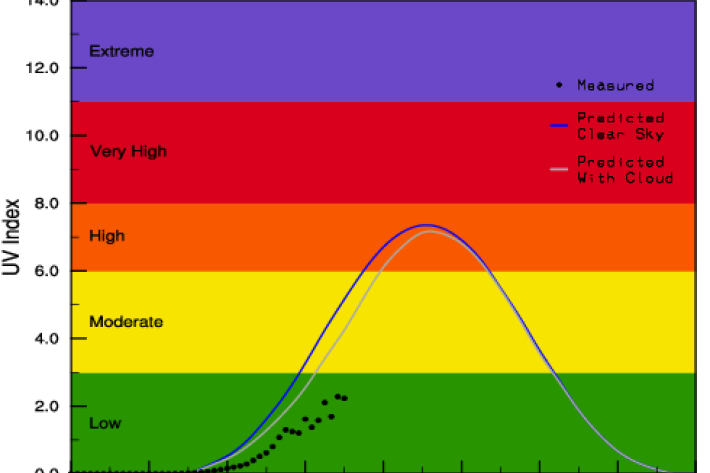
UVI forecast for Specific Sites
Check out UV index forecasts for locations in New Zealand (including ski fields), Australia, the Pacific and Antarctica. -
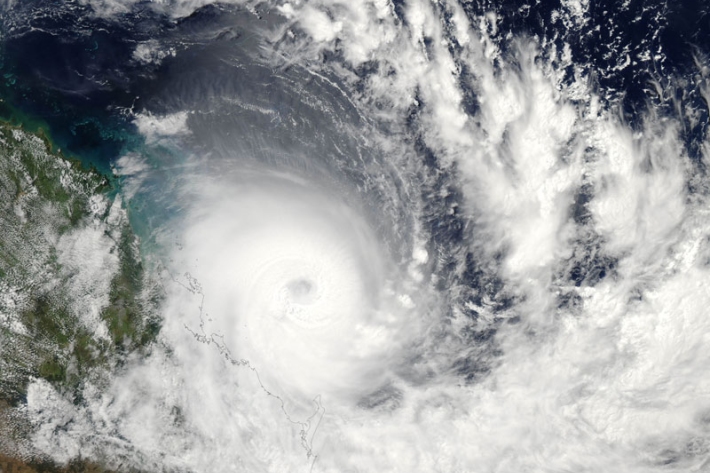
Storms and cyclones
Education ResourceCommon questions about storms and cyclones in New Zealand. -

Climate change, global warming and greenhouse gases
Climate data and common terms explaining the causes and effects of climate change. -
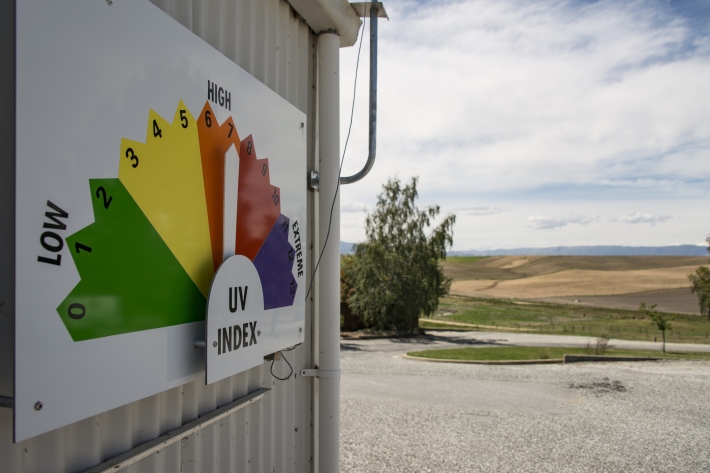
UV Index Information
The UV Index is a measure of the intensity of UV radiation. The larger the number, the more intense the UV. In New Zealand, its maximum summer value is generally about 12, but it can exceed 13 in the far North. In winter it reaches peak values of 1 or 2. Values of 10 or more should be considered as "extreme". At high altitude tropical sites (eg Mauna Loa Observatory, Hawaii), the UV Index can exceed 20.The UV Index supersedes the idea of "Time to Burn" or "Burn Time", which has been used previously in New Zealand.