PDF of this article (106 KB)


How could climate change affect us?
NIWA has just released new projections of climate change in New Zealand. The projections are the combined result of regional climate modelling and statistical ‘downscaling’ (producing results for New Zealand from global projections by using what we know about how New Zealand’s climate relates to broader climate patterns).
“The evidence of climate change continues to mount, climate models are becoming more sophisticated, and scientific knowledgeof the climate is improving all the time,” says David Wratt, NIWA’sGeneral Manager Climate Change.
What’s happening already
- Increasing temperatures: about 0.9 ºC over the past 100 years.
- Reduced frost frequency over most of the country: Canterbury and Marlborough experience about 20 fewer frosts per year now than in the early 1970s.
- Retreat of major South Island glaciers: volume of ice in the Southern Alps reduced by almost 11% in the past 30 years. Twelve of the largest glaciers are unlikely to return to their earlier lengths without extraordinary cooling of the climate.
The projections
Future climate change depends partly on how much extra greenhouse gas goes into the atmosphere. For this reason, NIWA scientists used six different scenarios of how the world might develop over the rest of this century, but mostly focused on a middle-of-the road scenario.
Temperature
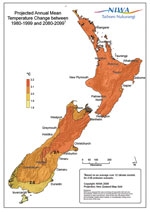
Temperature is projected to increase by about 2 ºC by 2090 for a mid-range scenario.
This is about the difference in the annual median temperature between Wellington and Auckland.
Extreme temperature
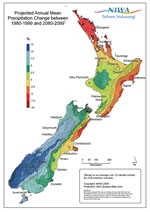
As the map (right) shows, the overall picture is for a drier climate in most of the east coast and north of the North Island, coastal Canterbury, and coastal Marlborough, and for a wetter climate in the west and south of the South Island.
NIWA scientists also produced rainfall projections for each season:
- winter & spring: all 12 global climate models used by NIWA for this study point to increased westerly winds, especially over the South Island. This means drier in the east & north, but more rain in the west of both islands.
- summer & autumn: different models point in different directions, but the average pattern is that westerlies decrease slightly over almost all of New Zealand. NIWA scientists have less confidence in this result than in the annual, winter, and spring projections.If these projections are borne out, less frequent westerlies would mean drier summers and autumns in the west of North Island, and possibly wetter in Gisborne and Hawke‘s Bay for those seasons.
Extreme rainfall
Heavy rainfall is likely to get heavier and/or more frequent. For a mid-range scenario, what is a 1-in-100-year event now could become a 1-in-50-year event by the end of the century.
For further information, contact: Dr David Wratt, 0-4-386 0588, [email protected] Dr Brett Mullan, 0-4-386 0508, [email protected]
