PDF of this article (235 KB)

High-resolution modelling can find the weakness in a town’s flood defences.
Alistair McKerchar and Graeme Smart explain how new models are refining the process of predicting damaging floods.
To avoid flood damage we need to keep people and property out of the path of floods. There are well known strategies to do this:
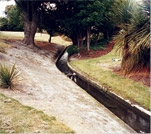
- control flood flows using flood detention dams protect vulnerable areas with engineering works such as stopbanks or floodways
- exclude property development from vulnerable areas and
- give warnings of pending floods (see ‘Flood forecasts for New Zealand communities’).
These strategies all require that we know the size of the flood that is to be controlled, protected against, avoided, or forecast. This means we must estimate flood peak flow rates and how often these floods can be expected.
Predicting flow
Hydrologists define the likelihood of flood peak flows by their annual exceedence probability (AEP). A so-called 100-year flood does not mean that there is exactly one flood of this size every 100 years. It means that there is a 1 in 100 chance in any given year that a flood of this size or bigger will happen; it is therefore more correctly called a 1% AEP flood. In any given year, there is about a 65% chance that there will be at least one 1% AEP flood in populated catchments of New Zealand.
Where sufficiently long records of flood flows are available for a river or stream, hydrologists can estimate the AEP of different flood sizes by determining how often floods of a given size occur. When records of previous floods are not available, we use two alternative methods to estimate flood sizes. The regional method looks at flood magnitudes for other similar streams with longer records, and design estimates are scaled to match the site in question. The second method, the rainfallrunoff model, uses information about rainfall frequency over a drainage basin (or catchment) to estimate a corresponding peak flood flow. The model translates the rainfall information into flood information.
In our experience, regional methods that interpolate flood frequency information are generally more reliable than rainfall-runoff models. With funding from the Foundation for Research, Science & Technology, NIWA scientists are revising and updating flood estimates for all New Zealand regions.
Calculating the frequency, size, and duration of flood flows in rivers is not sufficient to know whether particular areas will be flooded or not. We still need to determine how far waters may spread when floods spill out of their normal river course; this is known as inundation.
Predicting inundation
Traditionally, the extent of flood inundation has been estimated by recalling data on historic flood levels, or else calculated by surveying floodplain sections and assuming that these have horizontal water surfaces. These methods may lead to considerable errors in predicted areas and depths of inundation. While the prediction of peak flow and timing of river floods is a relatively mature science, precise calculation of inundated areas and local flood depths is a relatively new undertaking.
Reliable inundation calculations require massive amounts of very detailed topographic data and large computing resources. Airborne surveys using LiDAR (laser radar) can now provide maps of the ground surface that have a ground level measurement for every square metre of terrain over areas of tens of square kilometre. Because such datasets contain enormous volumes of data (typically, a model uses 5 000 000 ground elevations) and the data are collected with little manual intervention, identification of any errors in the data is difficult. In addition, parts of the topography, including the river bed, can change during the passage of a flood, due to scour and deposition, and the resistance to flow caused by vegetation along the river bank or sediment movement increases or decreases as floodwaters rise and fall.
Even with these complications, we have completed several high-resolution inundation models. Before they can be used to predict future inundation depths, the models must be tested to see whether they can accurately reproduce water levels measured in historical floods
Model results
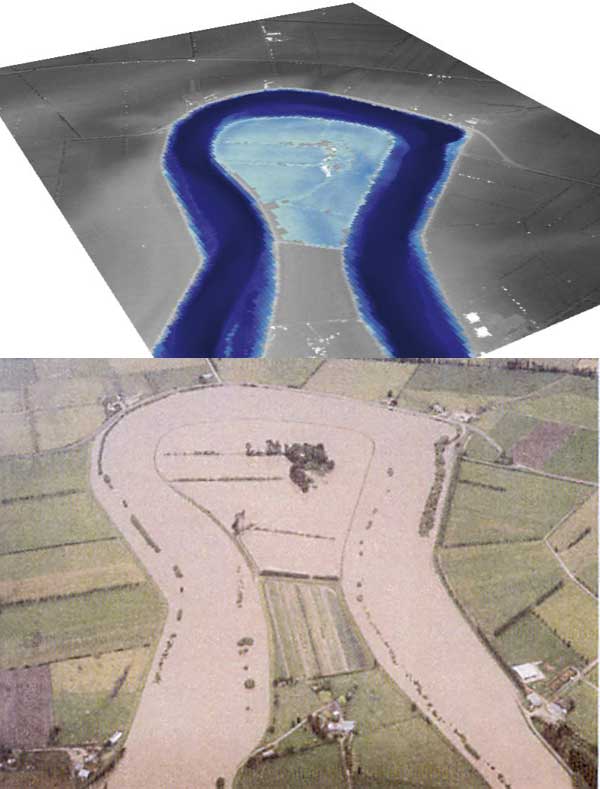
We can see the accuracy of our models when we compare predicted inundation with actual flooding. The river images right show the Mosley Road meander of the Matau Branch of the Clutha River in Otago. The first image shows computerpredicted water levels for a river flow of 5100 cumecs (m3 per second; the average flow in this part of the river is 600 cumecs). The second image is an aerial photo of the Clutha River taken in November 1999 during a flood when the flow was 5100 cumecs. The average difference between computer-predicted and fieldmeasured water levels was less than 20 cm.
An example of application of a high-resolution inundation model to a New Zealand town is shown right. Water levels were calculated every 4 m throughout the town. Grey areas show the surface of the ground, houses, and trees as detected by LiDAR. Rainbow-coloured areas represent the inundation from a 1% AEP flood. The red areas are deepest and occur in the river channel. Green and blue zones are progressively shallower. The model indicates that this town’s flood protection banks would be overtopped in the event of a 1% AEP flood.
Putting the models to use
In New Zealand, the current Building Act (2004) specifies that surface water from 2% AEP events (50-year floods) shall not enter housing. However, there is about a 90% chance that there will be at least one 2% AEP flood in populated catchments of New Zealand in any given year. Given these statistics, it’s not surprising that we often hear news of flood disasters in our country. Though we can’t stop the rain, new technologies and our improved models can help refine flood predictions. With more accurate information, councils and other land managers can be prepared for the inevitable.
Staying high and dry
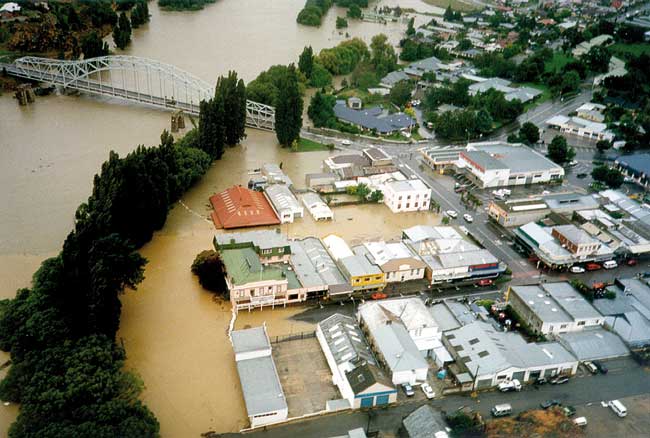
- Floods are our most frequent and damaging hazard.
- Past records tell us how often to expect damaging flood flows.
- Inundation modelling shows areas that are at risk and need long-term protection from floods.
Dr Alistair McKerchar and Dr Graeme Smart study hydrology and hydraulics; they are based at NIWA in Christchurch.
Teachers’ resource for NCEA Achievement Standards or Unit Standards: Geography Level 1 US5083, Level 3 US5095, US5097, AS90703