PDF of this article (2 MB)
Mark Sinclair
Recent NIWA research shows that northern New Zealand is hit by an average of a little over one storm of tropical origin each year. The severity of these storms depends on their location and on the phase of the El Niño/La Niña cycle.
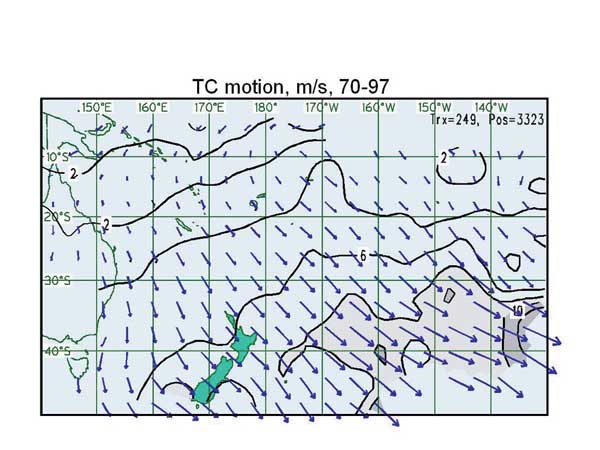
Average distribution, motion and intensity for all tropical cyclones during 1970–1997. top: Distribution. Contours represent the number of tropical cyclones passing within 555 km of each point per year, drawn at intervals of 0.5; values greater than 2 and 3 are shaded. middle: Average storm motion vectors, with speed contours added every 2 m/s; speeds greater than 8 and 10 m/s are shaded. bottom: Average cyclone intensity as defined in the table; values greater than 2.4 and 2.6 intensity units are shaded.
Every year between December and April, storms from the tropics move south toward New Zealand. As these tropical cyclones advance poleward, they eventually lose characteristic hurricane features such as the eye and the surrounding symmetric cloud and precipitation region and progressively acquire the asymmetric cloud and thermal features more typical of a frontal mid-latitude storm. Scientists use the term extratropical transition (ET) to refer to this poleward movement and accompanying structure changes.
As these storms move into New Zealand waters, they often maintain sufficient vigour to produce damaging winds, high seas and heavy rain. Occasionally, tropical cyclone remnants re-intensify in the extratropics to become potent mid-latitude storms capable of inflicting loss of life and severe property damage.
Several memorable ET events have occurred in the New Zealand region. In April 1968, Tropical Cyclone Gisele re-intensified as it moved south over New Zealand, producing winds gusting to 75 m/s (270 kph) in Wellington, and sinking the interisland ferry Wahine with the loss of 51 lives. Cyclone Bola dumped over 900 mm of rain and produced hurricane-force winds in regions of northern New Zealand in March 1988. More recently, Cyclones Fergus and Drena brought torrential rain and storm-force winds to the North Island in December 1996, triggering an exodus of summer tourists from coastal resorts.
Cyclones near New Zealand
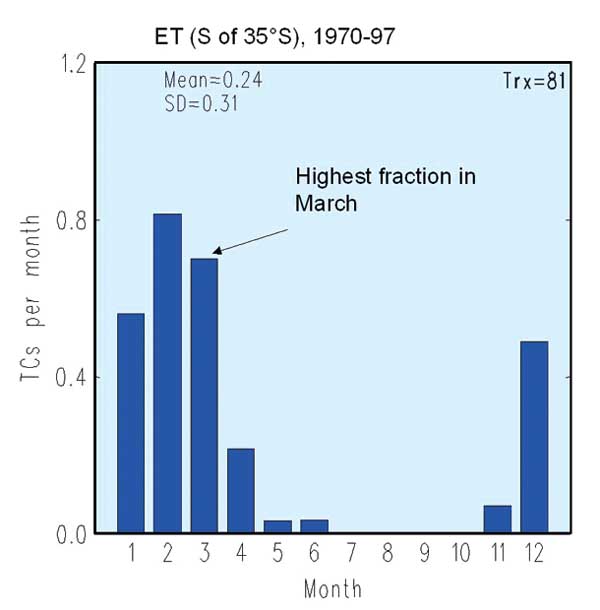
Frequency by month of tropical cyclones progressing south of 35°S from 1970–1997 data. The total number of storms was 81.
Tropical cyclone “best track” and intensity data are compiled and archived by the MetService and kindly provided to NIWA. This database contains time, location and estimated intensity, for all south-west Pacific tropical cyclones detected since 1939. Before the advent of satellite imagery in 1969, many storms went undetected by the sparse observational network. Therefore only data from 1970 onward were used for this study.
The top illustration shows the average distribution for all tropical cyclones during 1970–1997. Of the nine or so that form each year, on average, slightly more than one will pass within 5° latitude (555 km) of Northland and Auckland. There are progressively fewer close encounters farther south.
In the Tasman Sea, west of New Zealand, average storm motion – shown in the middle illustration – is only about 5 m/s due south. On the other hand, east of New Zealand, tropical cyclones move away to the south-east at speeds exceeding 8 m/s. Average tropical cyclone intensity – see the bottom illustration – is greatest near latitude 20–25°S, indicating that most storms moving into New Zealand waters are weakening. Storms that undergo ET in the Tasman Sea are more vigorous than those east of New Zealand.
As the graph above shows, largest numbers of tropical cyclones make it into middle latitudes (south of 35°S) in February and March. If we compare these events with overall cyclone numbers (which also peak in February), we see that March is the month during which the greatest fraction of storms will take a track into middle latitudes. Put another way, this means that, given a tropical cyclone, it is most likely to move south of 35°S in March. This corresponds to the time of warmest sea temperature, a factor that scientists have shown to be essential for tropical storm survival.
An ENSO connection
Teachers: this article can be used for Planet Earth and Beyond L4 A.O. 1. See other curriculum connections at www.niwa.co.nz/pubs/wa/resources
The location and intensity of ET is also affected by the phase of the El Niño–Southern Oscillation (ENSO) cycle. During El Niño years, tropical cyclones enter middle latitudes anywhere between the Australian coast and about 150°W and typically weaken quickly as they move away to the south-east.
During La Niña years, ET is largely confined to longitudes west of the dateline (longitude 180°). These storms move more slowly toward the south and tend to retain their vigour for longer. Interestingly, the strongest storms appear to affect New Zealand when the ENSO cycle is between El Niño and La Niña.
Mark Sinclair was formerly based at NIWA in Wellington and is now with Embry-Riddle Aeronautical University, Prescott, Arizona, USA.
Recommendations from International Experts’ meeting
The work described in this article is being conducted following recommendations from a recent international Extratropical Transition (ET) workshop. Risk Prediction Initiative, a science/business partnership, funded the workshop. At the meeting, leading authorities on ET proposed an agenda to guide future ET research.
Recent NIWA-sponsored research has addressed several Risk Prediction Initiative recommendations for the south-west Pacific Ocean basin. One of these recommendations is to compile basic statistics for ET for each of the ocean basins that experiences hurricanes (called tropical cyclones in our region). This research extends and synthesises a number of case studies of individual ET events in the NZ region.
Classification of south-west Pacific tropical cyclones
| Intensity Class | Description | Speed range (knots) | Central pressure (hPa) |
|---|---|---|---|
|
1 |
Tropical depression |
<34 |
>995 |
|
2 |
Gale |
34-47 |
995-986 |
|
3 |
Storm |
48-63 |
985-975 |
|
4 |
Hurricane |
>63 |
<975 |