River water temperatures and visual clarity of rivers.
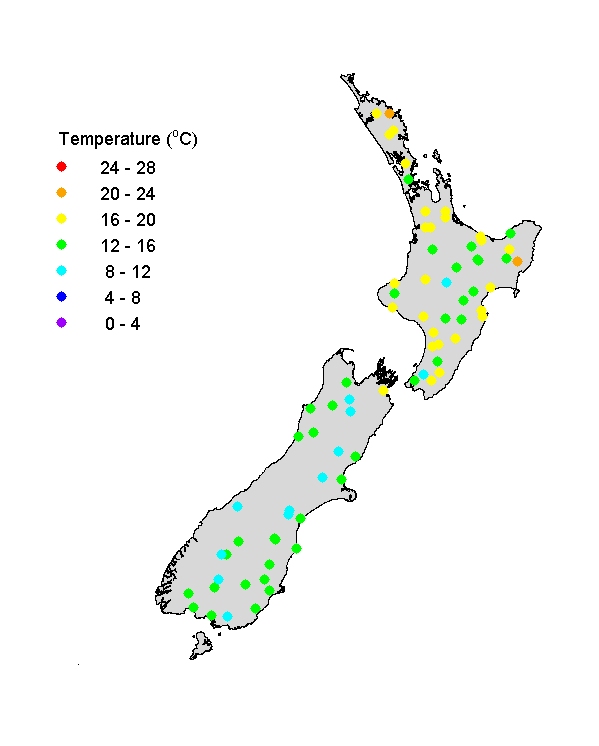
River water temperatures (OND)
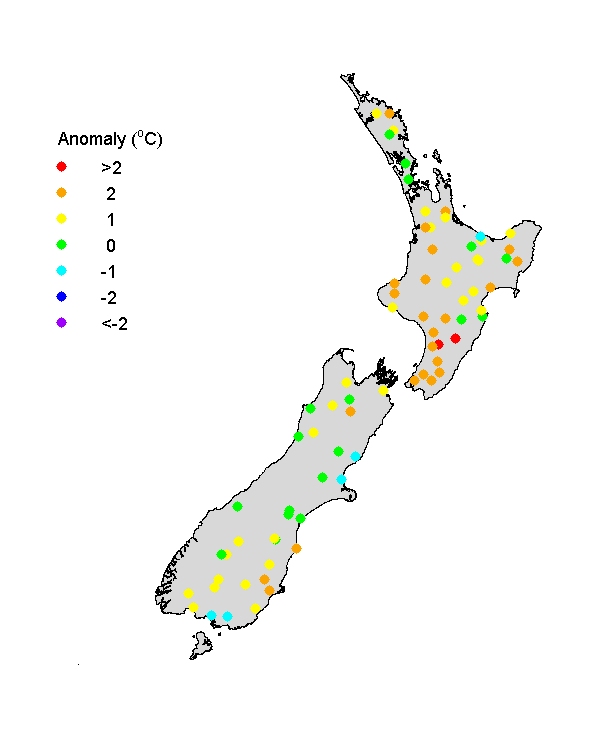
Spring river water temperatures were mostly in the range 8-16oC in South Island and a little higher in much of North Island. As usual there is a weak trend of decreasing temperature moving south (increasingly latitude), and a more definite trend of decreasing temperature with increasing altitude. The temperature anomaly map shows that river temperatures were normal to somewhat higher than normal for spring, over much of the country but particularly in lower and western North Island and large parts of South Island. The Manawatu River (lower, North Island) was unusually warm.
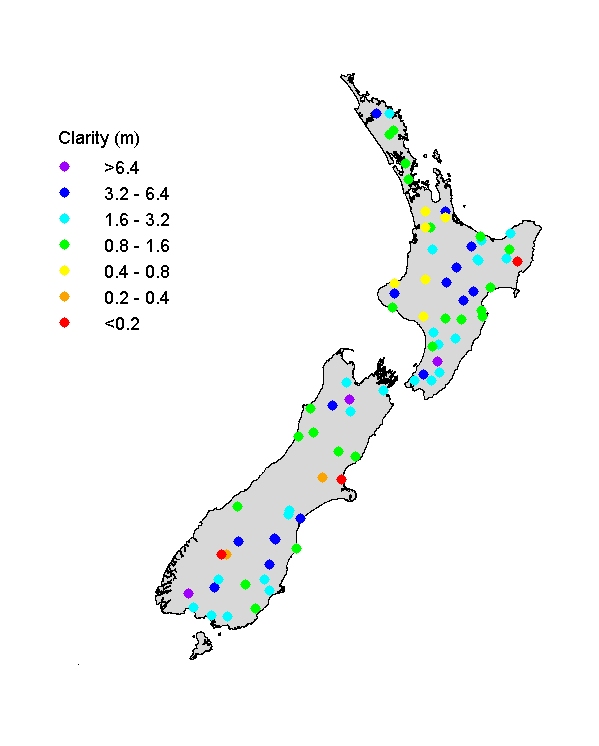
Visual clarity of rivers (OND)
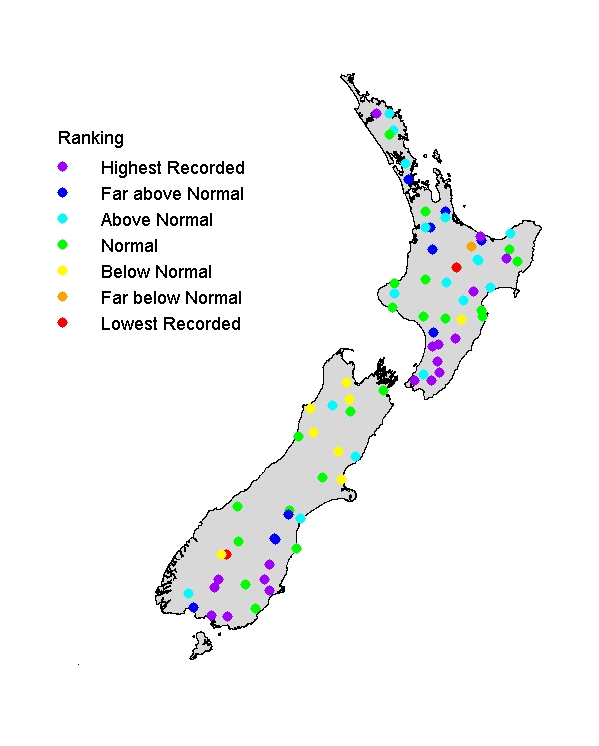
Visual clarity of rivers ranged widely (from <0.2m to >6 m) through Spring, reflecting the diversity of soil and rock types and vegetation cover in New Zealand. Rivers draining livestock pasture are characteristically less clear than rivers in forest catchments. The clarity ranking map shows that many rivers were clearer than typical, probably reflecting lower than typical flows (because visual clarity and flow are inversely related). Rivers in southern South Island and also in lower North Island (e.g., Manawatu, Ruamahanga and Hutt) tended to be unusually clear.