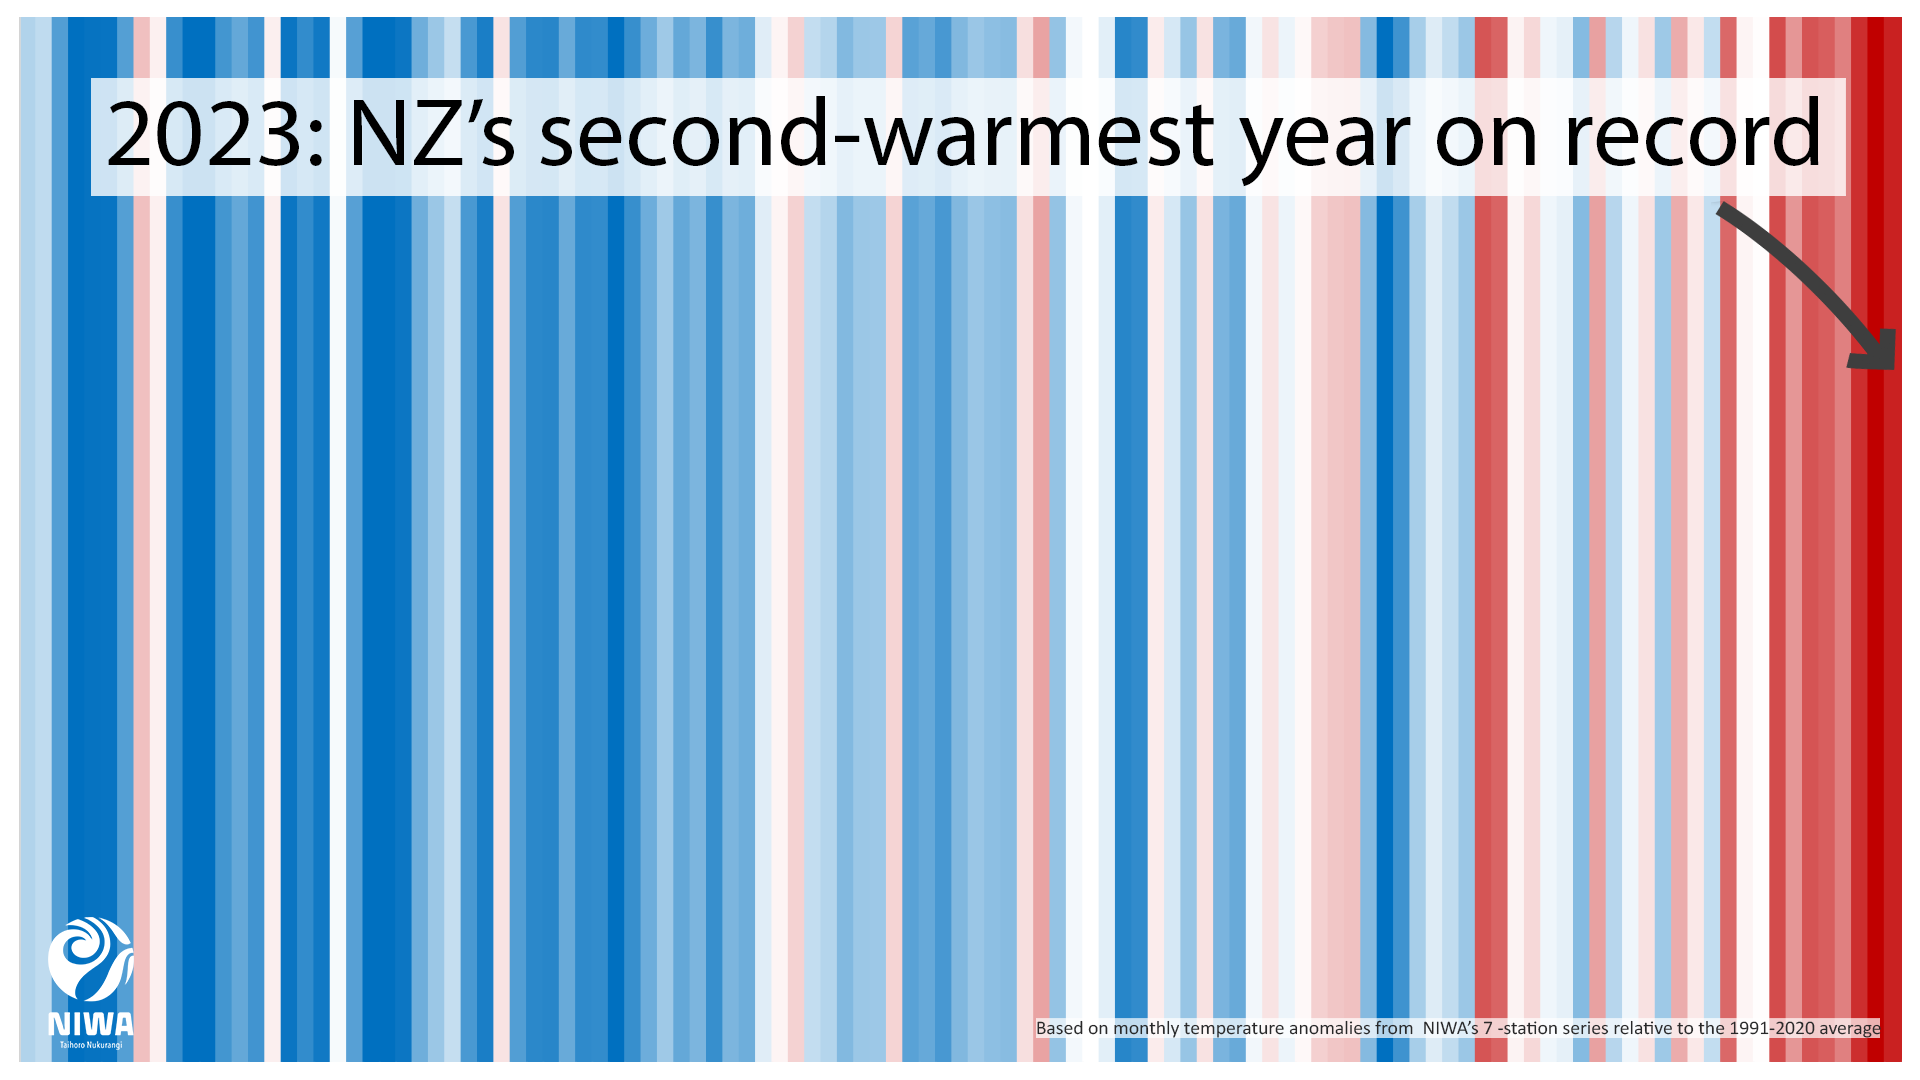
2023: New Zealand’s second warmest year on record
| Temperature | 2023 was New Zealand’s 2nd warmest year on record, based on NIWA’s seven station series which began in 1909. Annual temperatures were above average (+0.51°C to +1.20°C above the annual average) or well above average (>1.20°C above the annual average) for much of Aotearoa New Zealand. Small pockets of near average temperatures (within -0.50°C to +0.50°C of average) were observed around Northland, Auckland, Bay of Plenty, Gisborne, Hawke’s Bay, eastern Wairarapa, southern Marlborough, Canterbury high country, and Otago. |
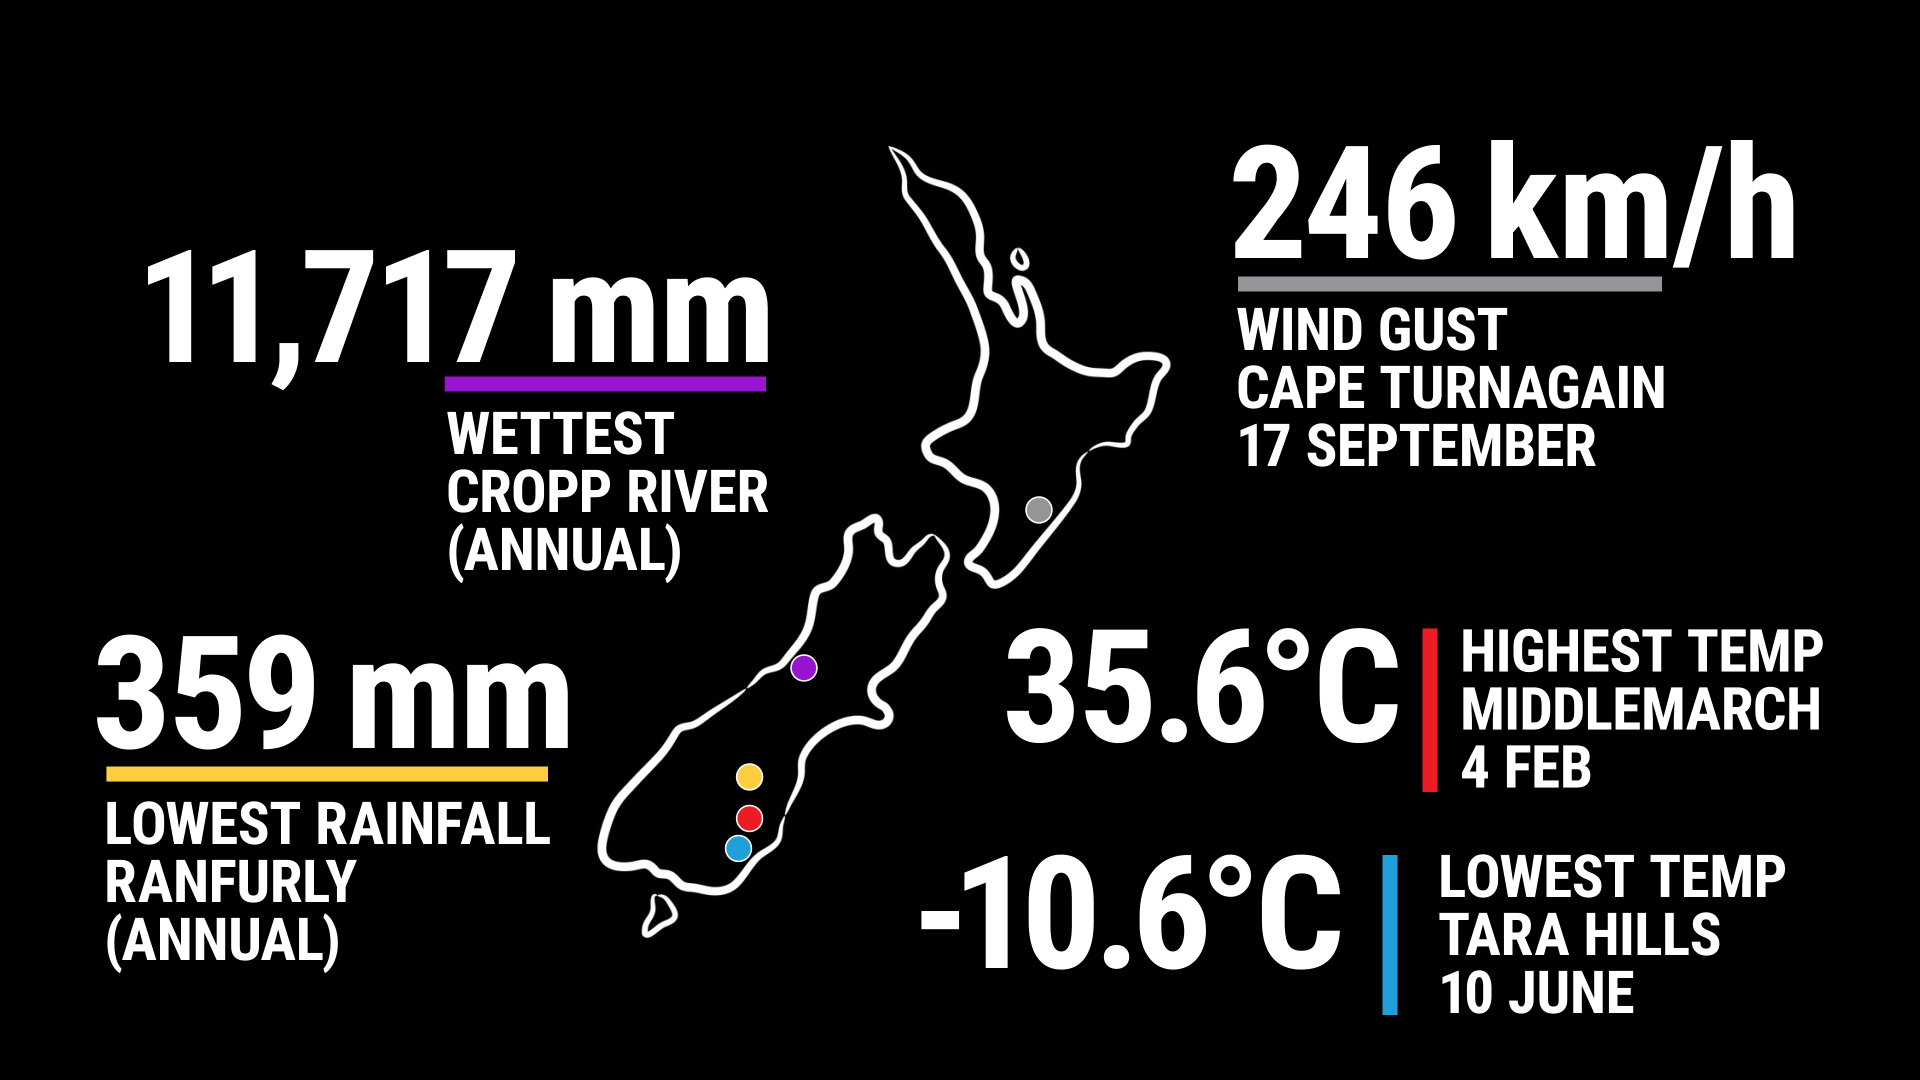
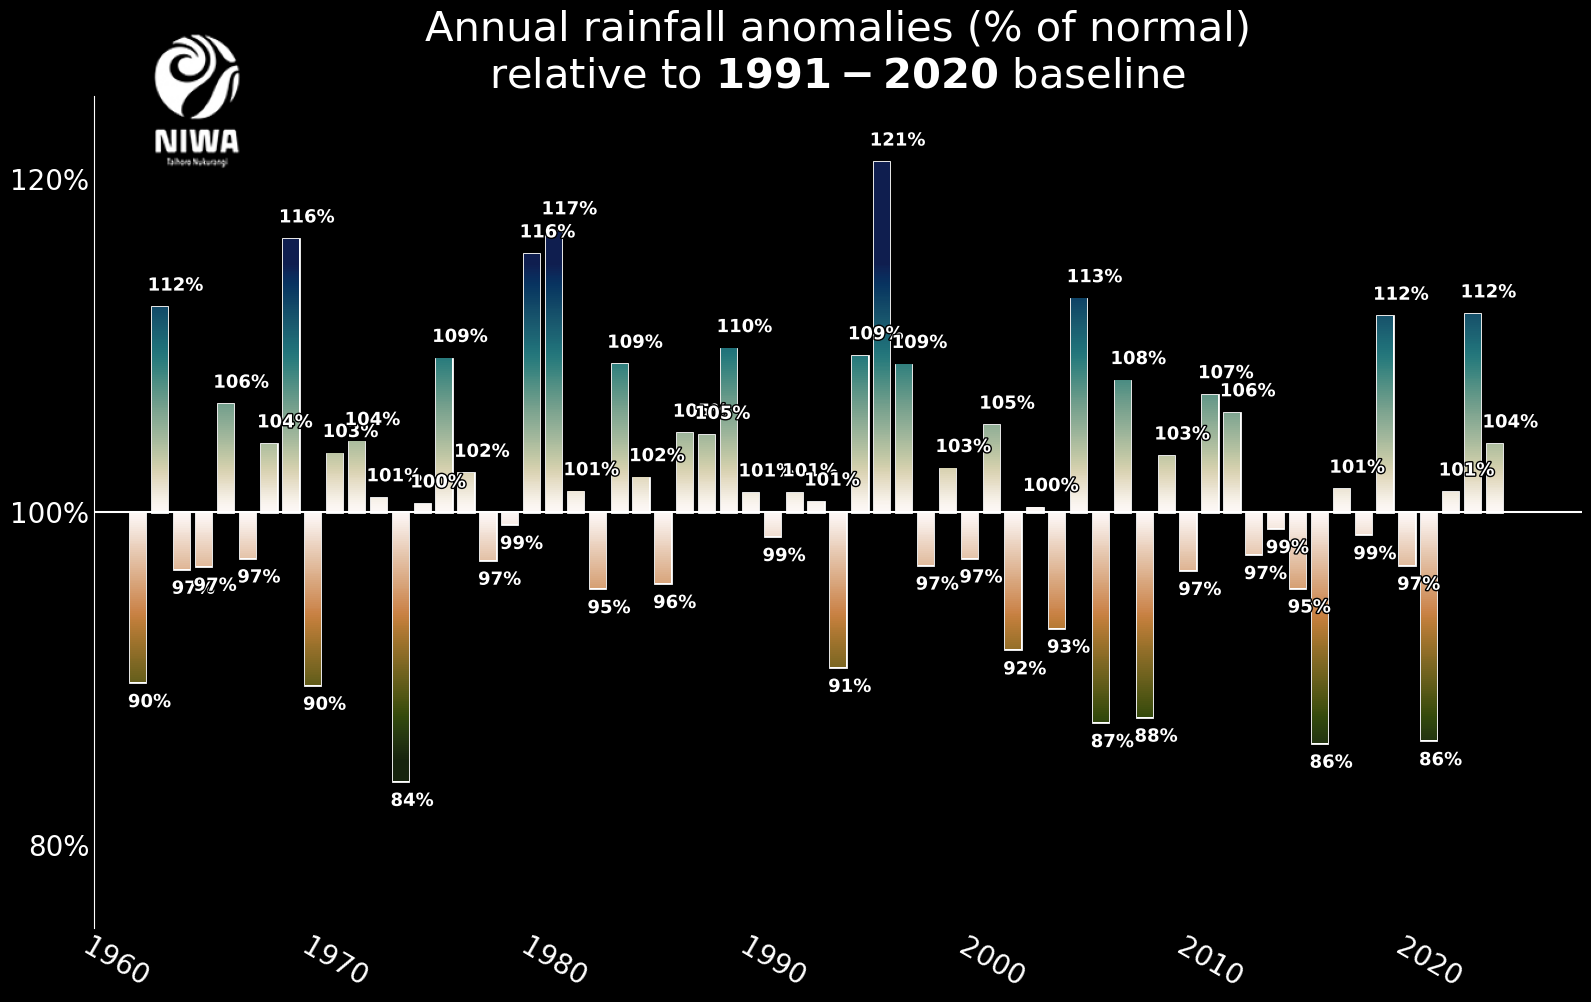
| Rainfall | Rainfall was well above normal (>149% of annual normal) for parts of Northland, Auckland, Coromandel, Gisborne, and Hawke’s Bay, while above normal rainfall (120-149% of annual normal) was observed through these same areas, as well as much of eastern Wairarapa, the eastern Tararua District, and Bay of Plenty. Near normal rainfall (80-119% of annual normal) was observed for the rest of the country, except for small and isolated areas of below normal rainfall (50-79% of annual normal) in the Central Plateau, West Coast, South Canterbury, and eastern Otago. Despite the number of extreme rainfall events during the year, 2023 was only New Zealand’s 21st wettest year on record. |
| Soil moisture | During January and February, soil moisture levels were considerably higher than normal across the majority of the North Island as well as parts of Canterbury and Marlborough, with below normal or near normal soil moisture levels elsewhere. During mid-February, meteorological drought emerged in pockets of eastern Otago, with very dry to extremely dry conditions occurring across the rest of Otago, much of Southland, South Canterbury, Banks Peninsula, northern West Coast, and inland Tasman.This pattern of above normal soil moisture for the North Island lingered into autumn, while the wettest soils in the South Island shifted towards Mid and South Canterbury and Otago. By the end of winter, soil moisture levels had returned to near normal for much of the country, although lingering pockets of above normal soil moisture were still present in parts of Canterbury and Otago. During spring, soil moisture levels became above normal for parts of the North Island, although some pockets of below normal soil moisture also developed across both islands.At the end of December, above normal soil moisture was widespread throughout the central North Island, parts of Northland and Auckland, as well as the western Tasman and upper West Coast. Below normal soil moisture was observed in parts of Northland, East Cape, Wellington, the upper South Island, and across parts of South Canterbury, Otago, and Southland. |
| Sunshine | The Mackenzie Basin experienced New Zealand’s highest annual sunshine total during 2023 (2658 hours recorded at Lake Tekapo/Takapō). |
Overview
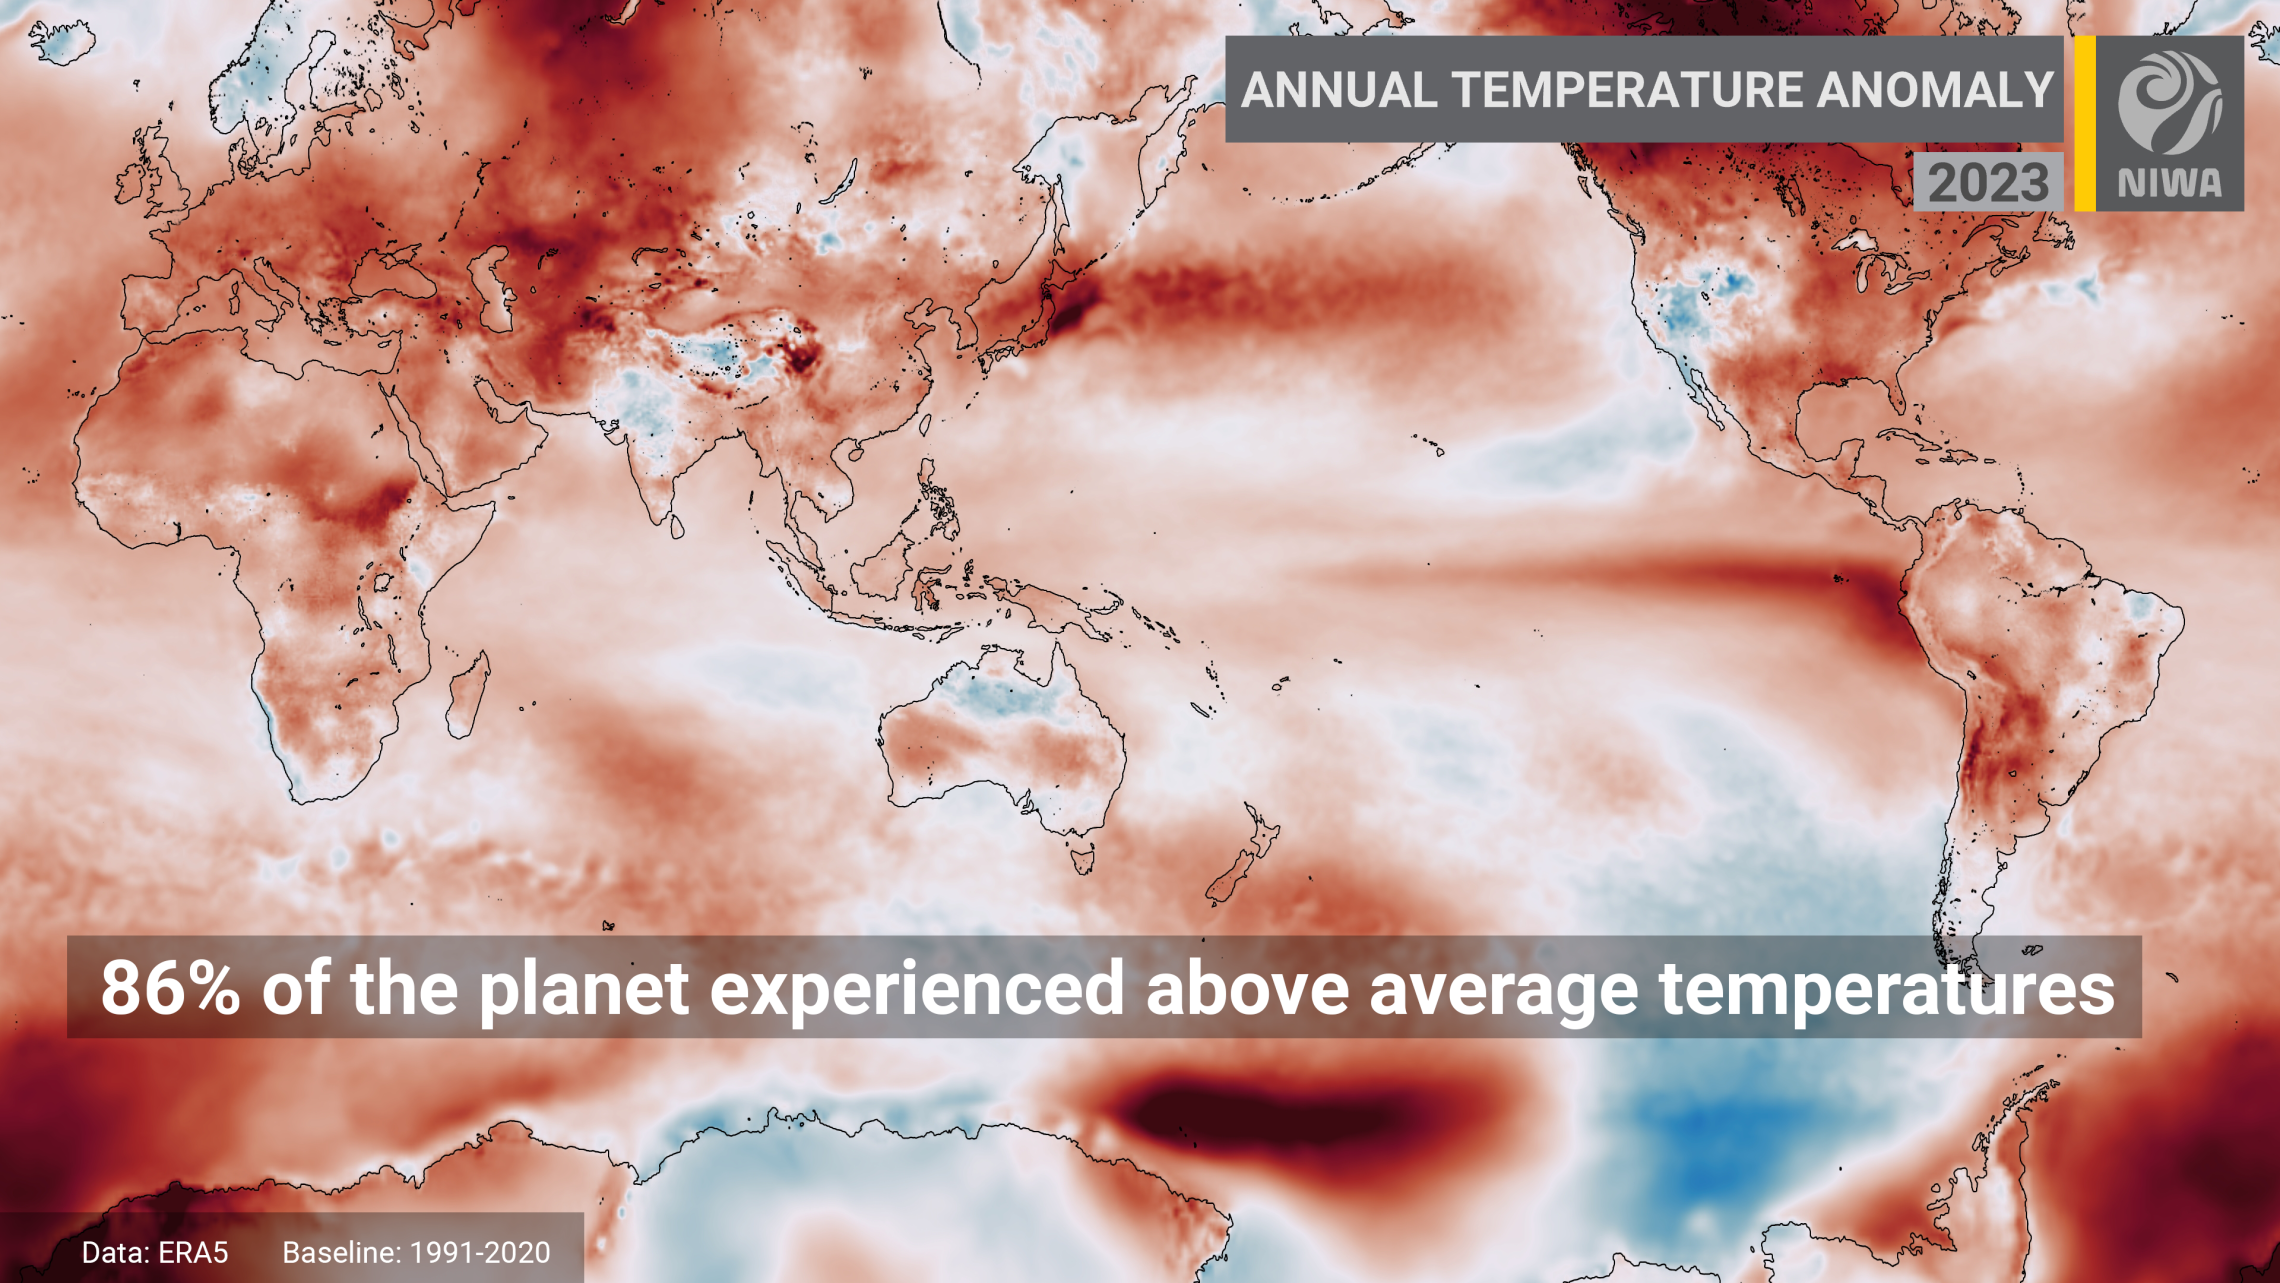
2023 was Aotearoa New Zealand’s 2nd warmest year on record, just shy of the record set in 2022 (Figure 1a). The nationwide average temperature for 2023 calculated from NIWA’s seven station series was 13.61˚C, being 0.87˚C above the 1991-2020 annual average. Both minimum and maximum temperatures were the 2nd warmest on record. New Zealand’s three warmest years on record have all occurred in the last three years. Globally, 2023 was the warmest year on record, with 86% of the planet’s surface area experiencing above average temperatures (Figure 1b). The clear warming trend observed both locally and globally is consistent with human-caused climate change.
Data from NIWA’s seven station series shows eight months of 2023 had temperatures that were well above average (>1.2°C above the monthly average) or above average (+0.5°C to +1.2°C above the monthly average). May and September were both the warmest on record, at an astounding 1.1°C and 2.0°C above their 1991-2020 monthly averages, respectively. Meanwhile, August was relatively cool, recording a mean temperature of -0.55°C below the 1991-2020 monthly average, the first month to have below average national temperatures (-0.5°C to -1.2°C below the monthly average) since May 2017.
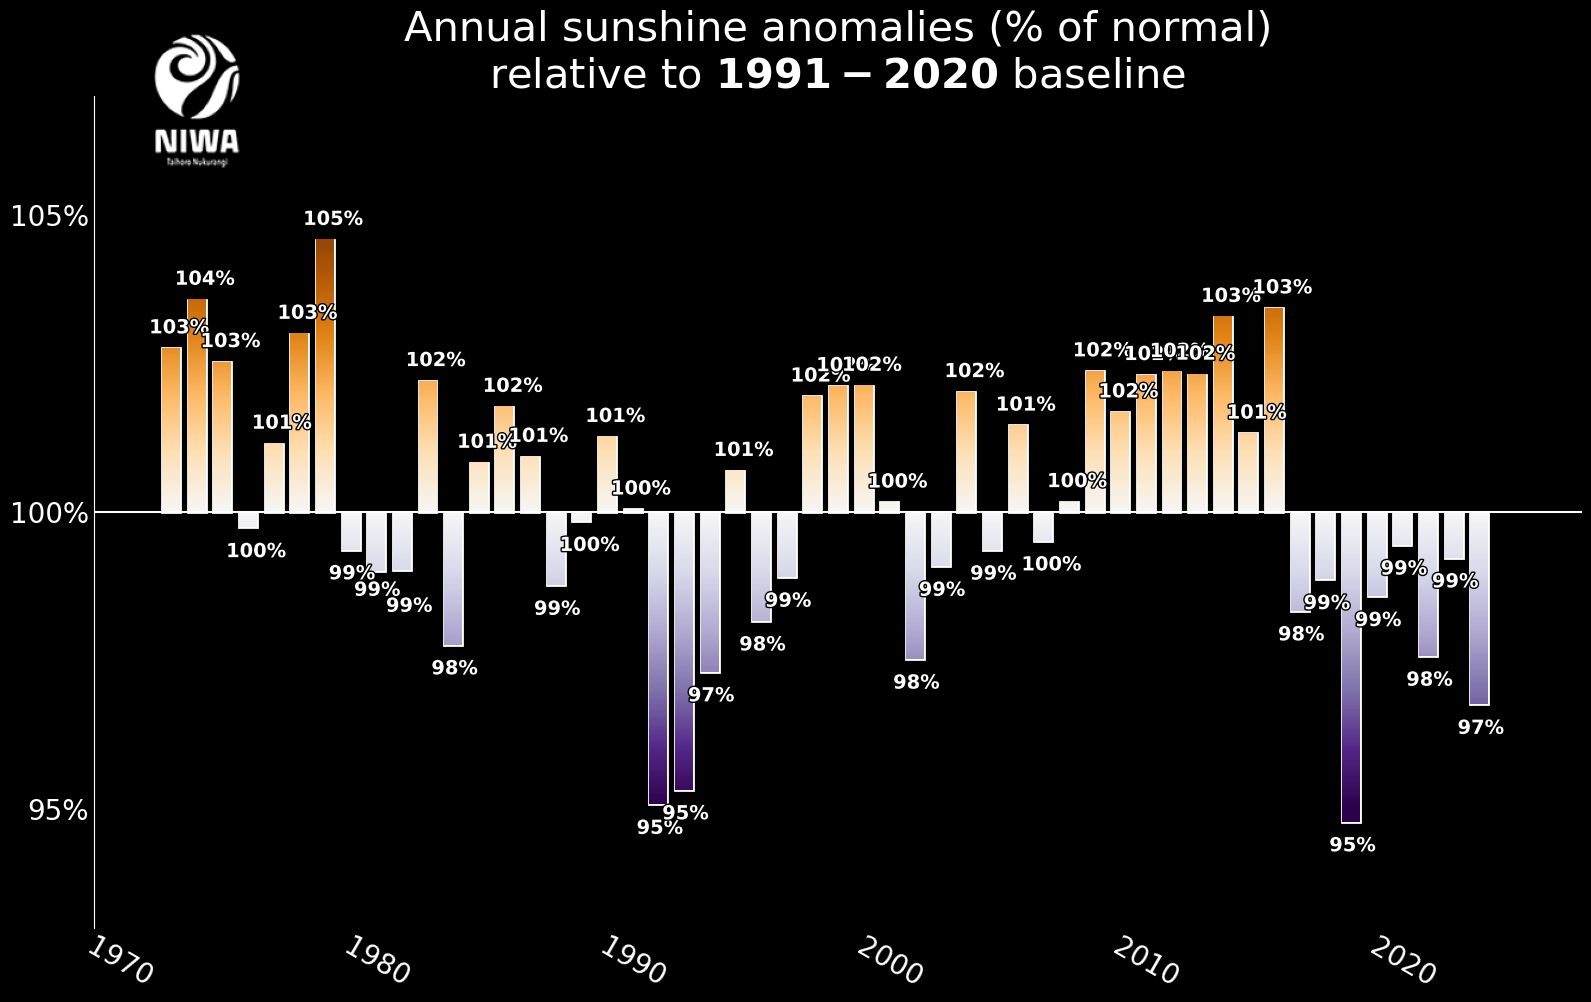
2023 was also the 4th cloudiest year on record (Figure 2a) and the 21st wettest year (Figure 2b), based on an analysis of NIWA’s Virtual Climate Station Network (VCSN), with records dating back to 1972 (for solar radiation) and 1961 (for rainfall). It was the cloudiest year nationwide since 2018. The nationwide solar radiation anomaly was 97% of normal, while the nationwide rainfall anomaly was 104% of normal compared to the 1991-2020 long-term normal.
Several climate drivers came together to produce an exceptional year of weather in New Zealand. One major climate driver of 2023 was the transition from a La Niña to an El Niño. La Niña is characterised by cooler than average ocean temperatures in the central and eastern equatorial Pacific, while El Niño is the opposite. Both La Niña and El Niño influence atmospheric circulation patterns in the Pacific Ocean, which have flow-on effects to regional climate across the globe through what are known as teleconnections.
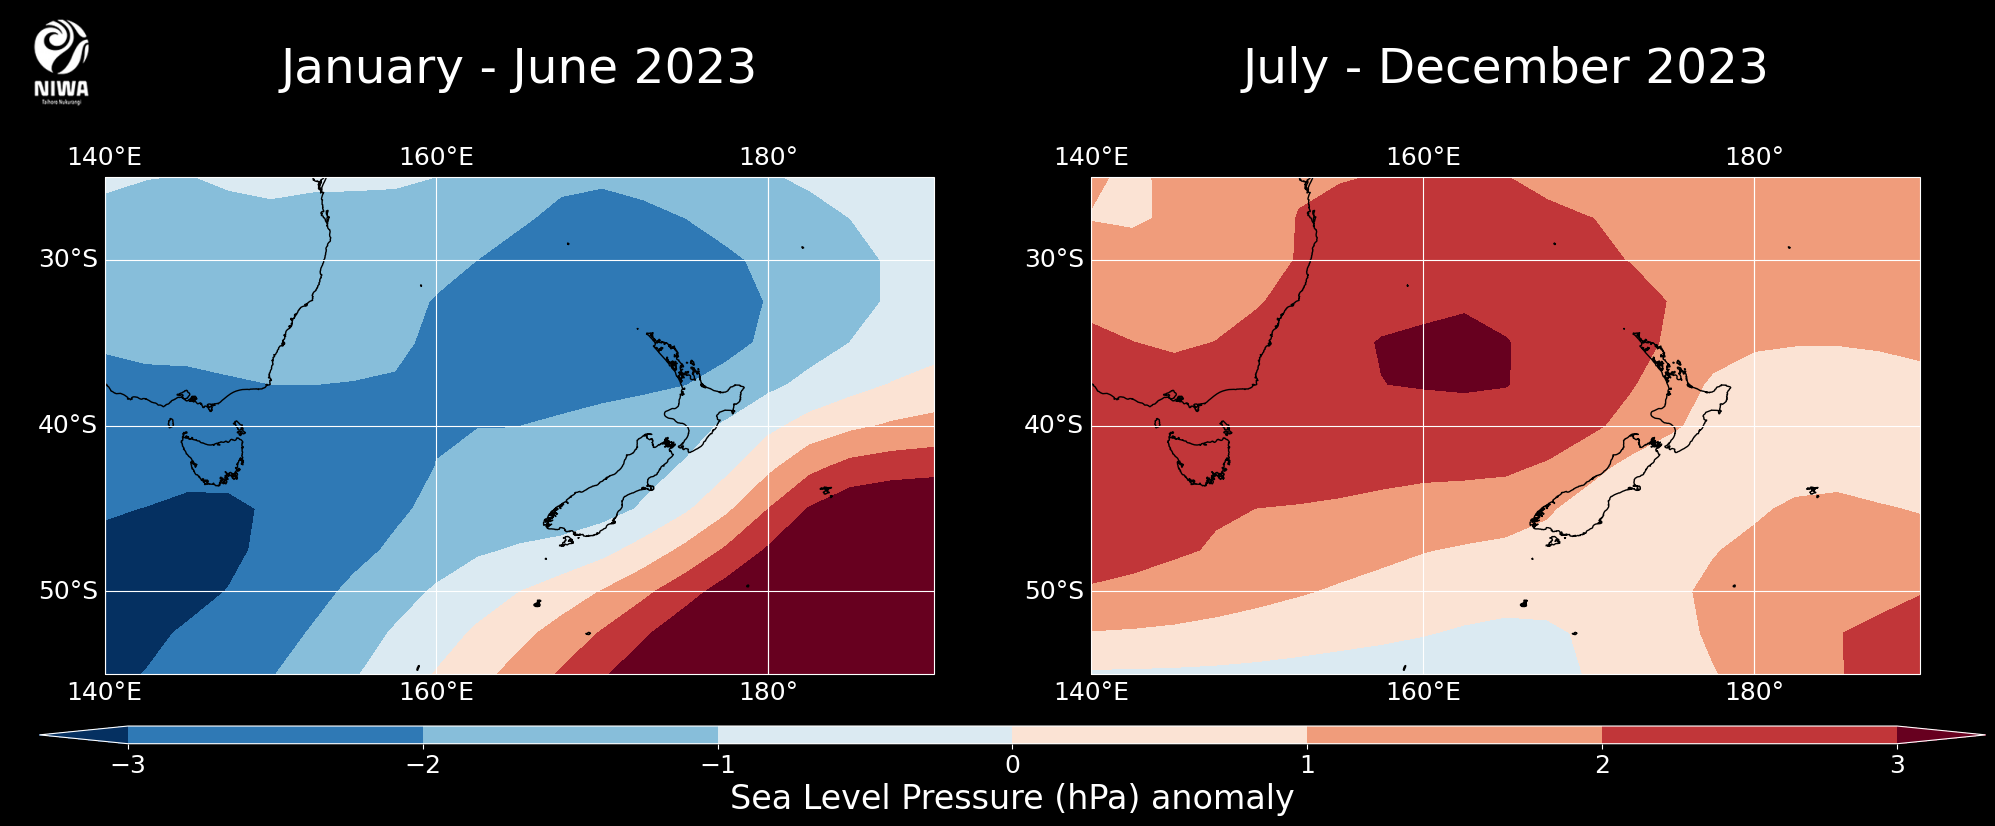
For New Zealand, La Niña tends to be associated with higher-than-normal air pressure near and to the east of the country with lower pressures to the north. This contributes to more sub-tropical, north-easterly winds than normal, increasing air temperatures, sea temperatures, and humidity. This air flow was common in the first half of the year (Figure 3a). Meanwhile, El Niño tends to be associated with lower-than-normal air pressure to the south and southeast of the country and higher-than-normal air pressure to the north. This can lead to an increased north-to-south pressure gradient, intensifying spring-time westerly winds and fronts as they move across the county. This air flow occurred more consistently during the second half of the year (Figure 3b), as the ocean-atmosphere transitioned to El Niño. However, one atypical element of the building El Niño was a persistent blocking high pressure system to the south-east of New Zealand, a holdover from La Niña. This high pressure system, shaded in dark red at the bottom right of Figure 3a and 3b, slowed the typical progression of weather patterns from west-to-east across the country and led to more northerly winds than what is usually associated with a classical El Niño circulation regime. This also contributed to additional heavy rainfall events in the north and east of the North Island, which are typically less common during El Niño.
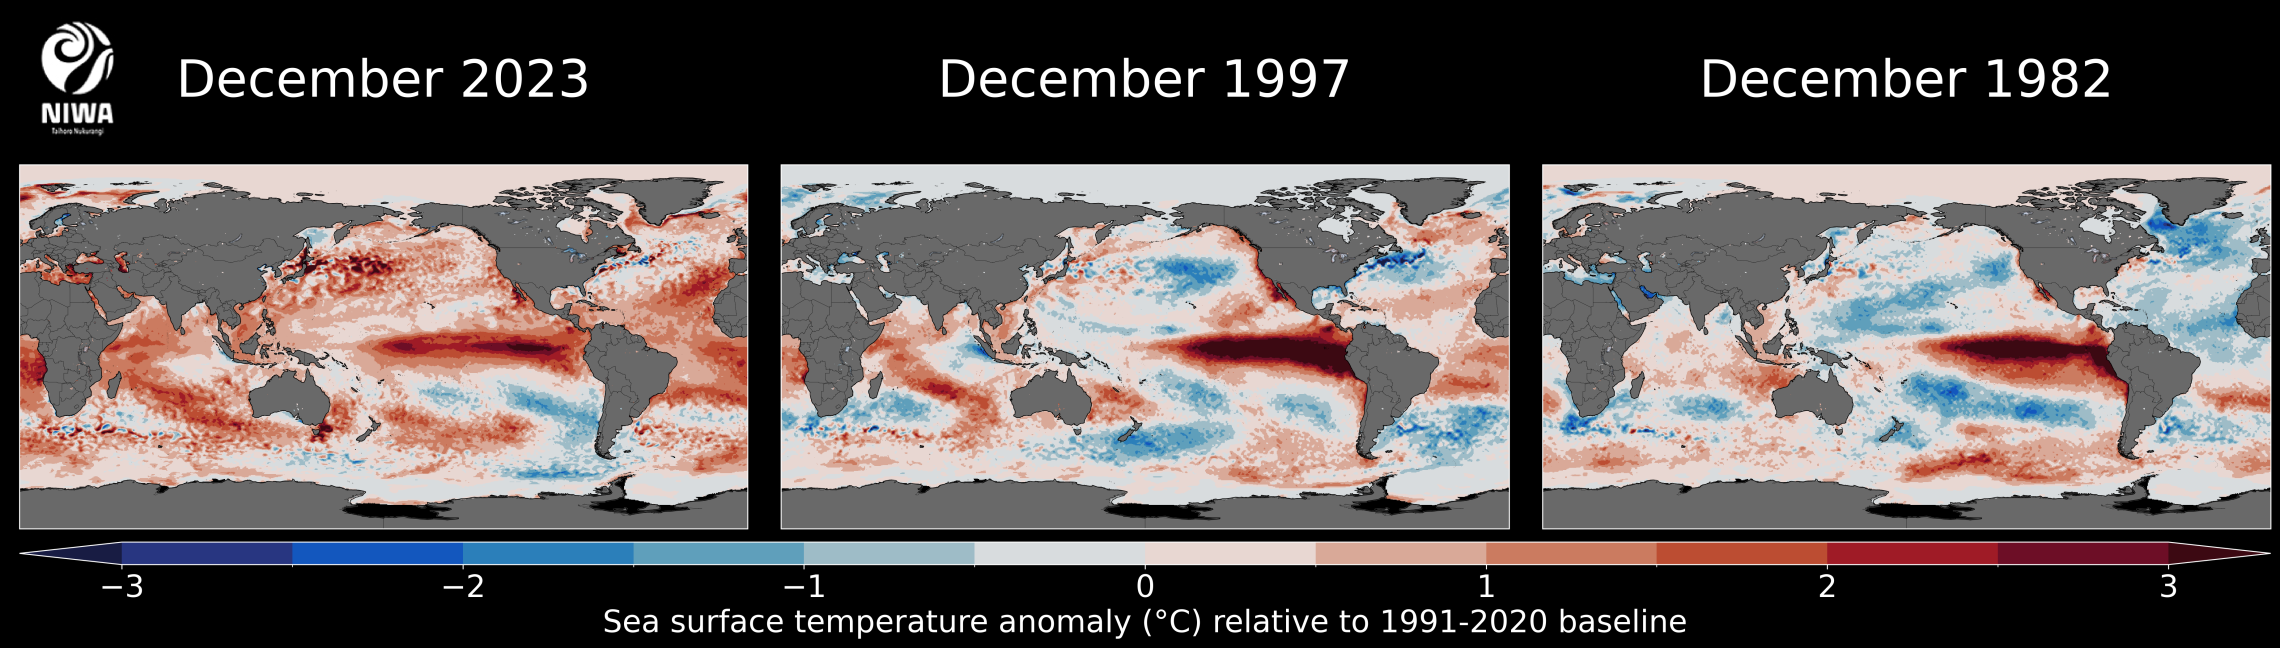
At the end of the year, SSTs in the west-central equatorial Pacific where El Niño is measured reached 2.01˚C above average, qualifying as a very strong oceanic El Niño. However, widespread above average SSTs in the Pacific and on a global scale contributed to weather patterns not typically associated with El Niño events. The clear difference between the 2023 El Niño event and the 1997 and 1982 events is illustrated in Figure 4, where there is an absence of the cold pool of SST to the south and east of New Zealand in 2023 and warmer than average SSTs for most of the globe.
Other notable differences were that the West Pacific Warm Pool, a large area characterised by permanent surface temperature >28˚C and considered the “heat engine” of the globe, was significantly warmer than average in the beginning of the year. While this is typically the case during La Niña episodes, sea water at depth in the western equatorial Pacific was more than 4˚C above average. This feature was likely a meaningful source of heat and moisture for many of New Zealand’s major rain events during 2023. Even as New Zealand’s climate transitioned to El Niño during spring, this area of very warm water was partly responsible for weather patterns not traditionally associated with a classical El Niño, such as moisture-fuelled low-pressure systems.
As an island nation, regional and local sea surface temperatures (SSTs) have an important influence on weather conditions in New Zealand. Warmer than average SSTs can increase humidity, lead to persistently above average air temperatures, especially near the coast, and provide more moisture for approaching low pressure systems. During 2023, coastal SSTs were average or above average nearly every month, with February ranking as the most unusually warm month with monthly SSTs off the west of the South Island peaking at 3.19°C above average. For the year, SSTs were at their warmest on record near the eastern South Island, 2nd warmest on record near the western North Island, northern South Island, and western South Island, and 3rd warmest on record in the eastern North Island since records began in 1981.
In the Indian Ocean, a see-saw of SST known as the Indian Ocean Dipole (IOD) transitioned into its positive phase during spring. This climate driver has historically been seen to amplify the circulation regimes associated with El Niño. However, despite this IOD event being one of the strongest on record, its impacts across the New Zealand region were muted in late 2023.
Finally, climate change continues to influence New Zealand’s long-term temperature trend, which has warmed at a rate of approximately 1.17°C (±0.2°C) per century according to NIWA’s seven-station series.
In January, wet and cloudy conditions dominated much of the North Island, while drier, hot, and sunny weather was observed in the South Island. On 27 January, a highly localised convective weather system delivered unprecedented rainfall amounts in an event dubbed the “Auckland Anniversary Floods.” Over 200 mm fell in just a few hours in many parts of Auckland and for the month of January as a whole, parts of the region received over 40% of their annual normal rainfall. In central Auckland’s Albert Park, it was the wettest month on record since records began in 1853.
As summer progressed, more heavy rainfall events marred the northern and eastern North Island. Ex-Tropical Cyclone Gabrielle impacted the North Island and the upper South Island during mid-February, leading to more historic flooding, this time in Hawke’s Bay, particularly around the Esk River, while other areas of New Zealand experienced heavy rainfall, powerful winds, coastal inundation, and large waves.
Despite a transition to ENSO neutral in March, the month saw more westerly winds than normal, before both April and May returned to northerly-quarter air flow anomalies, more typical of a La Niña regime. Several low pressure systems, enhanced by warmer-than-average SSTs in the Coral Sea and Tasman Sea and an ongoing marine heatwave near New Zealand, brought rain, cloud, and gusty winds to New Zealand, as well as a series of thunderstorm outbreaks. Nationwide, it was the 4th-warmest autumn on record.
The beginning of winter heralded frequent high pressure systems, bringing regular frosts and many calm days. It was a relatively dry season for many parts of the country, with a considerable reduction in the number of rain-bearing storms arriving from the north of the country compared to earlier in the year. The lack of cold southerly air flows and ongoing warmer than average SSTs meant it was a warm start to winter for most of the country and a challenging start to the ski season due to a lack of natural and artificial snow. Despite several cold outbreaks and sea-level snowfall later in winter into spring, average and maximum snow depths were almost universally below average across NIWA’s South Island snow observation network in 2023. At Mueller Hut, snow depths were at record-low levels for most of the season and melt out occurred one month earlier than average. Nationwide, it was the 5th-warmest winter on record.
During spring, El Niño was officially declared and strengthened in the tropical Pacific, with several strong westerly wind events signalling its building influence across New Zealand. It was a very wet season in Gisborne, northern Hawke’s Bay, and central parts of Northland, with some locations receiving more than double their usual spring rainfall. In contrast, it was a dry season in parts of the Greater Wellington region, with Upper Hutt, Martinborough, and Paraparaumu each receiving little more than half of their normal spring rainfall. It was the 10th-warmest spring on record.
During December, spring-like weather conditions continued, marked by variable weather. Above average temperatures continued with frequent north-westerly winds, highlighted by a period of tropical humidity at the end of the month.