Every last centimetre of the planet's surface has been measured, mapped and – thanks to Google Earth – made public. But what about our watery underworld? That map, finds Marieke Hilhorst, still has plenty of blanks on it...
New Zealand lays claim to a tract of ocean more than 20 times its landmass – the fourth-largest of any nation. That amounts to four million square kilometres of Exclusive Economic Zone, and 1.7 million square kilometres over the extended continental shelf.
Fully 96 per cent of New Zealand's territory lies below the waves, but we know very little about it: only 24 per cent of that vast underwater real estate has been surveyed – with just 8.7 per cent of it mapped using NIWA's high-resolution technology.
NIWA Principal Scientist, and manager of its marine ecology group, Dr Alison MacDiarmid, says the knowledge gap between New Zealand's dry and wet territory is huge.
"We wouldn't think of doing anything on land if we didn't have information. The first thing Europeans did when they got to New Zealand was to send surveyors everywhere, and start mapping and collecting information on geology and flora and fauna."
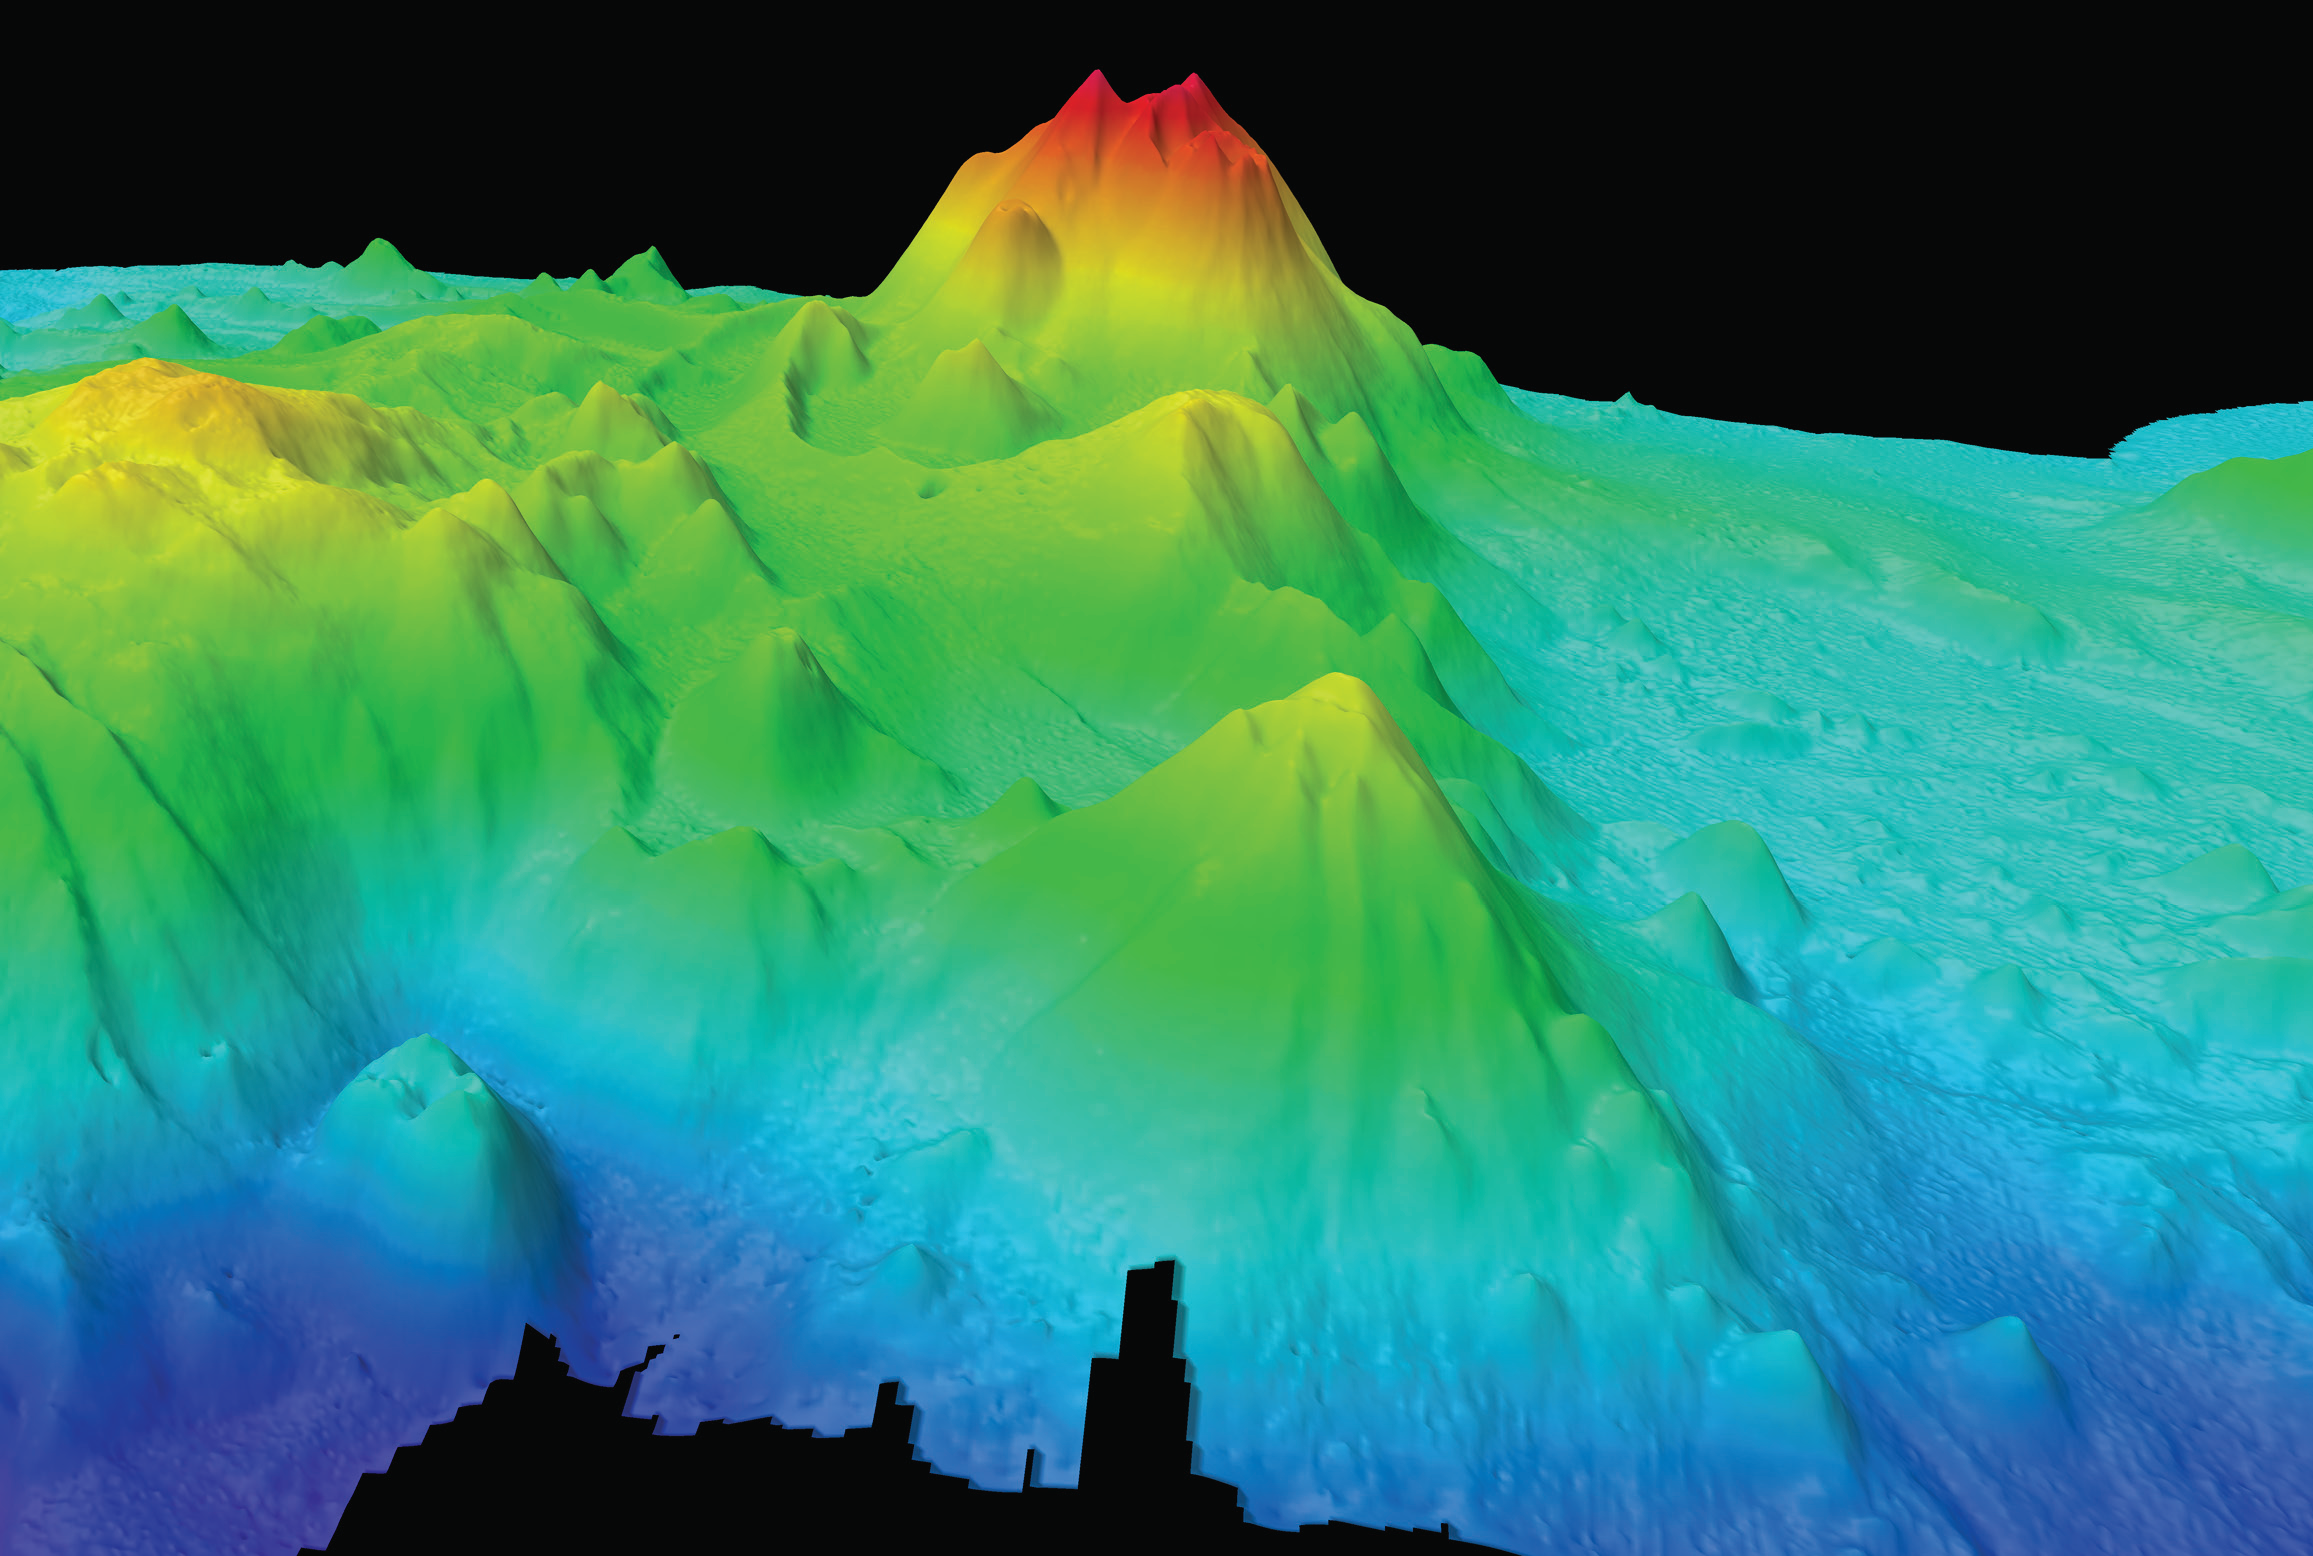
So while today's land-based topographical maps are rich in detail derived from aerial photos, satellites and global positioning systems (GPS), the seafloor lies largely unmapped, hidden below an inscrutable surface that masks a rich seascape of ridges, valleys, plateaus, canyons and seamounts.
That, says MacDiarmid, makes us complacent about how we use the ocean. "Imagine trying to do almost anything on land if you didn't have a detailed map; imagine trying to plan or manage the environment. It would be like standing on a mountain top with perpetual cloud blocking from view all the land below you, yet still making decisions about where to put roads and towns and farms and dams. It just wouldn't happen." But, she says, we do it with the ocean all the time.
Submarine stocktake
Ocean Survey 20/20 is one response to that. Launched in 2004, the comprehensive survey programme is the information backdrop to burgeoning demands on the ocean's resources – including gas, oil, minerals and fish – and part of the solution to a knowledge vacuum around hazards such as tsunamis.
Fifty-six priorities were originally set, covering nine themes including climate, biodiversity and ecosystems, hydrocarbons, fisheries, and natural hazards and risk management. The projects were chosen to address two risks: that uninformed development might lead to environmental damage; and that opportunities might be missed, should valuable resources lay undiscovered.
So far, four priority projects have been completed, as well as detailed seabed mapping to support surveys. David Mole, policy analyst at Land Information New Zealand, which coordinates the programme, says, "There's nothing else quite like it for what it may contribute to New Zealand's future economic prosperity, while ensuring sustainable management of marine resources."
Two more bathymetric surveys, closely aligned to the Ocean Survey 20/20 priority list, will be carried out this financial year, Mole says.
NIWA research vessel Tangaroa has been central to the Ocean Survey 20/20 work. In 2010, it traversed the Hikurangi Margin, off the Poverty Bay coast, where the Pacific Plate thrusts four to five centimetres beneath the Australian Plate each year – a clash that could trigger earthquakes and tsunami. NIWA and GNS Science worked together, collecting bathymetric data, along with seismic reflection and magnetic profiles from down to five kilometres below the seafloor. "Given recent events, it's become quite a high-interest survey for future hazard mapping and tsunami planning," says Mole.
Closer inshore, Tangaroa, along with NIWA's inshore survey boat Pelorus, was also used for a 20/20 survey in the Bay of Islands and along the Northland Shelf. Mole says that coastline is under increasing pressure from competing interests – fishing, aquaculture, tourism and recreation – and from sediments discharged from land.
The survey is a good example of how bathymetry informs evidence-based policymaking, he says. Data on seabed habitats and biodiversity provide both a snapshot and a baseline, and find multiple uses. "Government agencies, iwi groups, regional and district councils, port authorities, conservation groups; they're all able to draw on the information to develop and manage the Bay of Islands coastal resources in a more effective and sustainable way."
Seeing with sound
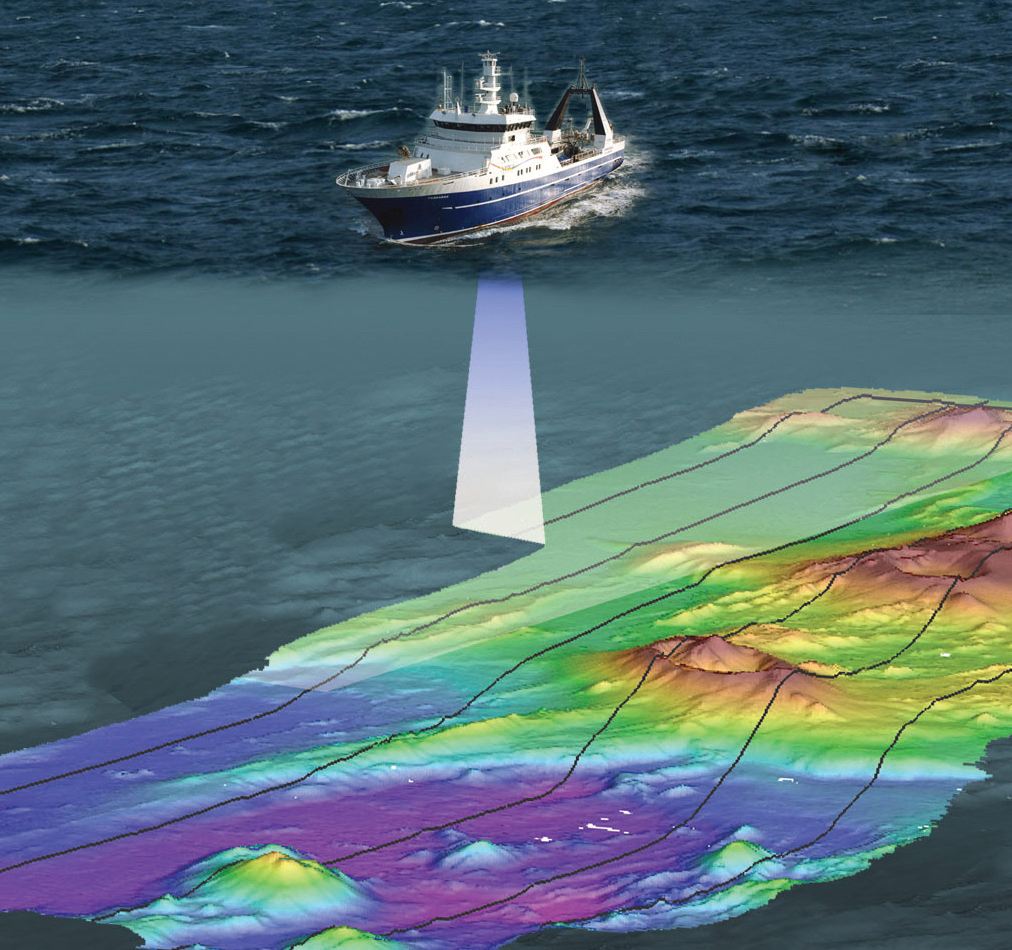
Tangaroa floats at the leading edge of NIWA's bathymetric work. Marine geologist John Mitchell is expert in running the vessel's Kongsberg 30 kilohertz multibeam echosounder. As it follows a bearing, transducers beam out a fan of sound, called a 'swath', up to eight kilometres wide, in water from 20 metres to 7.5 kilometres deep. Each 'ping' of sound hits the ocean floor, then bounces back to the ship, where the echoes are broken into 864 individual soundings per ping.
The time it takes the sound to bounce back is directly related to the water's depth. Meanwhile, the echoes also reveal not just the shape and contours of the ocean floor in high resolution, but also what's in the water column, such as plumes from underwater volcanoes and methane seeps. Moreover, the strength of the return signal (backscatter) indicates what the bottom type, or habitat, may be.
NIWA is still investigating how to best use the water column data, but Mitchell says the prospects are exciting. For example, plumes from active volcanoes may point to potential hazards, while methane seeps indicate the presence of gas hydrates, recently recognised as a potential energy source.
Using the multibeam echosounder is like mowing a lawn, he says. "You gradually go back and forth on parallel tracks collecting data, so you get 100 per cent seabed coverage, and you get a true 3D image of the sea floor." Tangaroa can cover huge areas: "If we're surveying in deep water, depending on the weather, we can cover up to 2000 square kilometres a day."
The concept is simple enough, says Mitchell, but to interpret the data correctly, he must first judge the signal's speed through water, which can vary wildly throughout the water column according to temperature, salinity and pressure.
What's more, he must direct the sounder accurately, even as Tangaroa rolls, pitches and heaves. To that end, the beams are directed by an instrument which can measure angles of just 0.02 degrees, and Mitchell calibrates every component before all major surveys.
Hazards and habitats
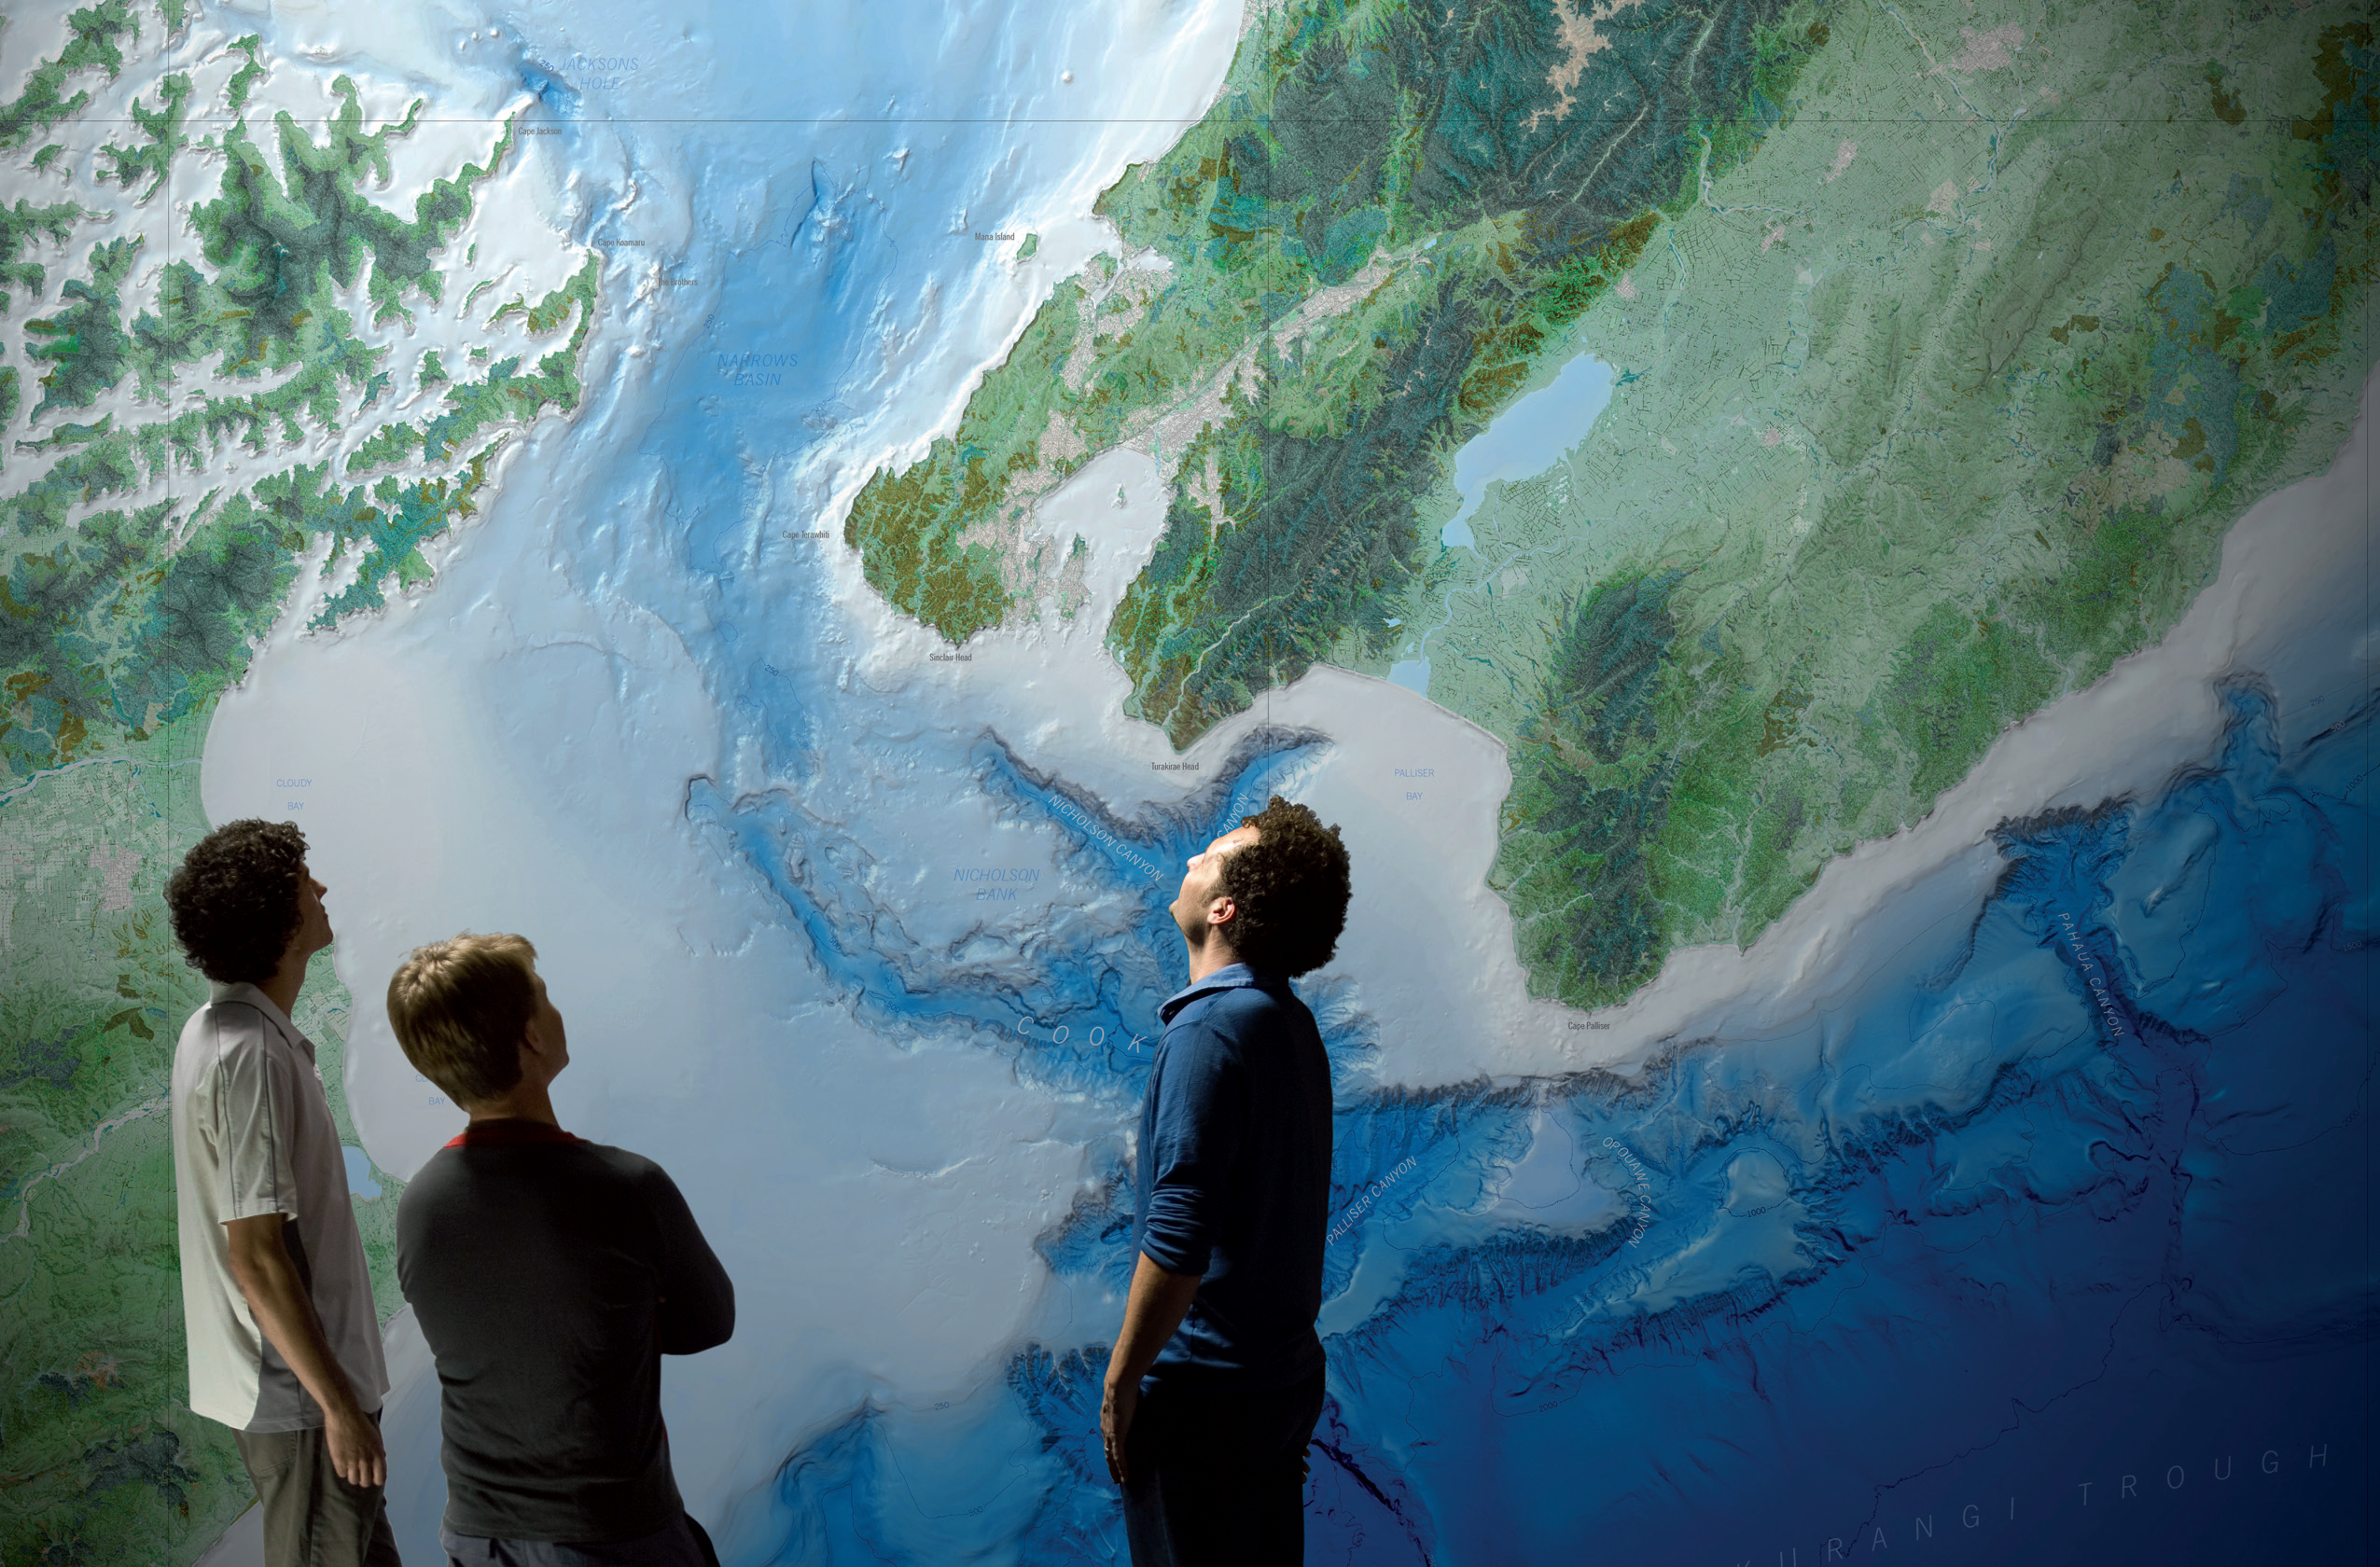
One of the many beneficiaries of Mitchell's efforts is Dr Joshu Mountjoy, a NIWA marine geologist. He's analysing data recently collected from New Zealand's largest underwater chasm, the Cook Strait Canyon.
The data reveal much about hazards just off Wellington's coast, including active faults that rise through the canyon system and across the continental shelf.
Mountjoy says more than 150 submarine landslides have been pinpointed, some likely caused by 1855's magnitude 8.3 Wairarapa earthquake, which re-shaped Wellington's waterfront and generated a moderate tsunami. NIWA and GNS Science are now quantifying the tsunami risk from future landslides.
Dr Malcolm Clark is a NIWA Principal Scientist (deepwater fisheries), and self-confessed enthusiast of New Zealand's more than 1000 seamounts. "There is amazing geology, volcanology, oceanography and biology associated with seamounts."
Back in the 1980s, the hunt for orange roughy saw more exploration – and exploitation – of seamounts. "Topography goes hand-in-hand with some fisheries," says Clark. "Where the seamounts are, you'll also find the fish." Back then, satellite navigation was cutting edge, and GPS was just a notion. "We'd get an occasional fix every few hours," recalls Clark, "and until you got a new fix, it was just dead reckoning. We couldn't stay fishing on a seamount once we'd found it, because without precise navigation, the currents would push the vessel off line, and there was too much risk to the gear."
Multibeam technology he says, has "pretty much revolutionised how we do all our science. When I first saw the images I thought, wow, this is one super-cool piece of technology for deepsea research."
A poster of a 2003 joint New Zealand/Australia survey in the Tasman Sea illustrates just how cool. The rudimentary lines on the 'before' map are piecemeal, stylised, reflecting 'bumps' detected by satellite altimetry sensitive to a gravitational pull on the water above seamounts.
By comparison, the rainbow-coloured 'after' maps not only render the precise location, height and contours of the seamounts, but their hardness and texture. It's that combination that gives Clark important clues about biology, because both are major influences on what survives where. "Habitat mapping is where bathymetry meets geology and biology," he says.
"Animals such as corals and sponges generally need hard substrate, like rocky outcrops or volcanic cones, for their holdfasts. They can't properly attach in deep soft sediments, and because they feed by filtering water, fine sand particles swept up from soft sediments can clog their filters."
So Clark closely studies the strength of the multibeam's backscatter – the return 'ping'. A weak echo usually indicates soft mud, while a strong one suggests rock; together, they give Clark and his colleagues a pixelated image of the substrate that helps them map the distribution of seafloor plants and animals. It all helps enable an ecosystem approach to seamount management, he says, where fishing impacts can be balanced by conservation of sensitive habitat.
Further biological and geological data from small trawls, sediment samples and bottom photographs add detail to the picture. NIWA can now produce intricate charts of water depth (bathymetry), colour-shaded relief models of the seafloor (like an aerial photo) and geo-referenced maps of seafloor habitats and substrates.
It's all a far cry from Captain Cook's lead weight on the end of a rope.
Find out more about NIWA's bathymetry work
See Tangaroa's multibeam technology in action
Take a fly-through trip of the Cook Strait Canyon
Watch NIWA scientist John Mitchell giving a potted history of bathymetry
Download New Zealand bathymetry charts
End
Applying the knowledge
Regional councils are responsible for management of the undersea environment out to 12 nautical miles. Some are currently testing a 'marine habitat assessment decision support tool' developed by NIWA, which draws on the institute's bathymetric data.
"What we needed," says Auckland Council marine scientist, Megan Carbines, "was a tool or criteria for determining what were significant habitats. We were hoping also to get a consistent set of criteria across New Zealand, rather than each regional council developing their own."
Carbines says the co-development of the tool, tailored to councils' needs, offered their scientists an opportunity to interact with NIWA's, and gave them access to emerging information and research, including national datasets they either didn't know existed, or had no practical access to. "That's been a really valuable part of the product."
Currently, Auckland Council is calibrating NIWA's tool against known habitats. "We're trying to look at as many habitat types as we can across a range, from degraded to pristine, and that will give us a whole lot of scores. What we don't have yet is information on how one habitat ranks against other habitats, because you need to have several scores from several places to create a rank." That will be the second phase of work.
Within two years, Carbines expects a national dataset to be created, which environmental managers can use to derive the relative rank and value of different habitat types.
The tool is already adding value, says Carbines, even under development. "Just having those criteria gives people a framework. It triggers you to consider in a structured format, a whole range of things you may not have considered, like the size of habitat, how common the habitat is in the region, the degree of native species, sediment levels and water quality.
"So I guess it's a kind of a check sheet for anyone wanting to undertake a habitat assessment; they've got a list of things they should be considering."