PDF of this article (282 KB)


Be prepared! Stefan Reese, Rob Bell, Andrew King, and the RiskScape Team are helping managers get ready for The Next Big One.
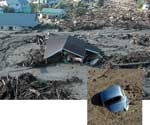
New Zealand is prey to a wide variety of natural hazards, from volcanoes and earthquakes to floods and tsunamis. To prioritise resources to combat these hazards, we need to know which have the largest impacts on all aspects of our communities. NIWA and GNS Science are jointly developing RiskScape, a regional multi-hazard tool that models potential losses and supports decision-making for the management of natural hazard events. RiskScape will improve the information and understanding of natural-hazard risks for a range of end-users, including land-use planners, emergency managers, and the insurance industry. Scientists at NIWA are focusing on weather and climate-driven hazards and GNS Science on geological hazards. To ensure that end-user needs are fully met, we’re developing RiskScape using three pilot sites that represent areas of different size and hazard characteristics. The initial prototype system was demonstrated to our three regional partners in July 2006.
A new tool that works with existing data
The project combines current scientific and engineering knowledge about the hazards, built environment, land uses, and social characteristics of communities to develop a powerful loss-modelling software package for analysing the potential impacts of events within different regions. Although we have a reasonable understanding of the various natural hazards at a national level, there is much less known about the amount of damage that can be caused to buildings and infrastructure (like roads and power lines), the effects on people, and the resulting economic and social impacts.
One of the strengths of RiskScape is the capability to incorporate other databases (such as road networks), hazard models, and even hazard-loss curves (used to estimate damage for a given hazard magnitude). This provides flexibility to use existing hazards and risk studies within RiskScape rather than having to redo work to fit the system. Another advantage is that consequences, such as damage to buildings, are calculated at an individual building scale, but can then be aggregated to larger areas (for example, a suburb) dependent on the requirements and the confidentiality of the building and infrastructure databases.
The elements and foundation of Riskscape
The RiskScape tool follows the six steps shown in the diagram. Using sophisticated hazard models, a hazard of a certain magnitude or return period is superimposed on the geographical spread of assets, people, and activities of the region. The damage or casualty rate is estimated for each asset by applying the exposure – for example, a flood of 1-m depth at that site – to the vulnerability – for example, damage likely for a house with a floor level of 40 cm above ground.
Inventories
RiskScape is built on three main modules plus the programming behind the tool. Inventories of all assets that may be impacted by the hazard form the fundamental base of a loss-modelling tool. Dealing with different types of hazards and numerous assets and land uses (agriculture, for example) requires a huge amount of information, particularly about the characteristics of the assets at risk; these might include construction characteristics of buildings, routes for utilities such as water supply, sewerage, road, and power, and demographic and business information. For much of this information, a comprehensive database on building and infrastructure attributes does not exist in New Zealand. For example, there are no nationally consistent data available for building floor height, which is relevant when flood water enters the building. Thus, we’ve undertaken targetted field surveys and explored new techniques, such as satellite imagery or laser-scanning (LiDAR), to get the necessary information about the assets at risk to fill some of the gaps.
Hazard modelling
The second main module of the RiskScape tool is hazard modelling. Computer models that simulate the hazard, such as the flow of floodwaters over floodplains or through streets, applied to specific buildings are verified against past events to validate the models. RiskScape can either import the hazard exposure fields, for example flood depths and flow velocity, from previous model runs or else compute these hazard fields internally, which is done for earthquake shaking.
Fragility/loss
The third element is the fragility/loss module, where the RiskScape framework assesses how much damage, for a given hazard exposure, would occur for a particular building or infrastructure type. Vulnerability or fragility curves are the most common way to estimate hazard-related damages because there is usually a correlation between monetary losses, the damage state, and the hazard intensity.
Software
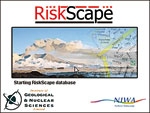
The RiskScape user interface guides the user through a hazard scenario, and a map display with very basic GIS capabilities renders the results. Hazards, inventory, and fragility functions are implemented as external modules; these are imported into the main RiskScape engine, which performs exposure and damage estimate calculations for user specified scenarios. Hazard modules contain either selective scenario results of third-party modelling runs or else a specific code to be run within RiskScape.
Managing the indirect costs of natural hazards
The risks are much wider than direct damage to our built environment because they include the impact on people and society. RiskScape also plans to address indirect losses, such as the disruption of economic and social activities, within and beyond the area of immediate direct physical impact. Incorporating both direct and indirect considerations provides planners and emergency managers with a comprehensive and detailed overview of possible consequences. This foreknowledge enables them to optimise mitigation strategies before a disaster occurs, thus saving money and lives and minimising community disruption.
Although RiskScape is still in the development phase, it has already attracted attention from a wide range of hazardmanagement sectors, including the insurance industry, engineering lifeline companies, and emergency managers.
Where is it safe
- Hazards hurt most when they affect our communities (or human infrastructure).
- A new tool helps compare the risk from different hazards.
- RiskScape can guide actions to reduce risk, both for future planning and for emergency response.
Dr Stefan Reese (NIWA, Wellington), Dr Rob Bell (NIWA, Hamilton), and Dr Andrew King (GNS Science) are leading the RiskScape project. Others on the team include Doug Ramsay (NIWA, Hamilton); Dr Jochen Schmidt, Roddy Henderson, Dr Graeme Smart, Dr James Goff, and Dr Gaby Turek (NIWA, Christchurch); Dr Steve Reid (NIWA, Wellington); and Dr Jim Cousins, Iain Matcham, David Heron, and Dr Warrick Smith (GNS Science, Lower Hutt).
Teachers’ resource for NCEA Achievement Standards or Unit Standards: Geography Level 1 US5083, Level 3 US5097, AS90703
