Testing times at Whatawhata
A sustainable land management (SLM) plan has been in place at Whatawhata Hill-land Research Centre since 2001. The plan is based on recommendations of a team of agricultural, land, water, and social researchers, resource managers, farmers, and foresters. It aims to enhance the long-term economic and biophysical sustainability of hill land that was previously performing poorly, both economically and environmentally. Changes involved better matching of land use to land capability and improvements to pasture management.
The steepest, least economic, half of the Mangaotama farm catchment was converted from pasture to pine forest, poplar was strategically planted in remaining erosion-prone pasture areas, and selected gullies and riparian areas were fenced and planted with native trees and shrubs. Stock type was also changed to better match the remaining pasture production and reduce the size of cattle carried during winter. The changes required significant investment, but stream monitoring has shown marked improvements in several aspects of water and habitat quality as well as reduced nutrient and sediment loads. Farm returns have improved slightly, despite having less land in pasture, and long-term economic projections predict significant improvement based on returns from timber harvesting.
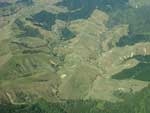
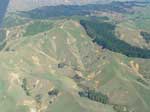
A storm on the evening of Waitangi Day 2007 provided the first real test of the land’s resilience to erosive forces during an intense rain event. A gauge in the middle of the study area recorded 110 mm of rainfall over 8 hours, with 97 mm falling in a 4–hour period within this event. Farm staff reported significant landslipping in some steep areas in pasture at the bottom of the SLM catchment and in areas of an adjacent catchment. Aerial inspection a month later showed the benefits of pine planting in preventing slip erosion. Thirty slips were recorded in 203 ha of pasture in the adjacent Mangaotama and Kiripaka catchments but no slips were observed in 126 ha of established native forest within the Kiripaka catchment or in adjacent fully forested catchments. Only 2 slips were observed in 180 ha of pines planted about 6 years ago, with 1 further slip in an area of gorse within a pine-planted area. There were 4 significant slips in an area of pasture that was planted in native shrubs and trees at the same time as the pines. This demonstrates the benefits of planting pine for rapidly enhancing the stability of rolling-tosteep hill lands.
It was a similar story in the adjacent Waitetuna catchment, where landslips were also quite widespread, and closed the road to Raglan. Around 100 slips occurred under pasture on steep slopes, but fewer than 10 were observed under forest (either native or exotic). In this valley, the amount of rainfall also influenced the density of landslipping. Most of the valley received about 100 mm of rain (similar to Whatawhata) and landslips were scattered. In an area near Waitetuna township which received 160 mm of rain, the density of landslips was much higher.
For further information, contact: Dr John Quinn, 0-7-856 1735, [email protected] Dr Les Basher, 0-3-545 7708, [email protected]
Wind toolbox debuts at Te Papa
NIWA’s considerable range of capabilities applicable to the wind energy industry were on display at the 2007 New Zealand Wind Energy Conference in March at Te Papa in Wellington. We demonstrated our wind-measurement, analysis, modelling, and forecasting ‘toolbox’ designed to answer many questions relating to wind energy. We fielded many enquiries about mapping the New Zealand wind resource and high-resolution forecasting of winds over the country. There was also a lot of interest in the animated display of eddies being shed off a hilly coastal site as an example of our ability to model turbulence using ‘Gerris’, a very adaptable computer code that describes fluid flows.
Talks at the conference covered the full range of issues related to wind energy, from choosing a site and getting resource consent to building turbines, keeping them running, and merging their fluctuating output into the national grid. The talks included a good mix of commercial and theoretical aspects of wind farming. A highlight for attendees was the lively and fairly frank descriptions by the major operators of the highs and lows of setting up and actually running a wind farm in New Zealand.
Speakers made some key points:
- Globally there is a 25% growth in wind energy utilisation each year.
- In New Zealand this year there will be a 100% increase in wind energy generation capacity (from Tararua 3 and White Hills).
- Most overseas wind farms rely on subsidies and considerably lower average wind speeds than are available in New Zealand.
- New Zealand has one of the best wind energy resources in the world.
- Although wind provides a fluctuating source of energy, it can be efficiently combined with hydro for the national grid.
For further information about the wind toolbox, contact: Dr Mike Revell, 0-4-386 0328, [email protected] Graham Elley, 0-3-343 7850, [email protected]