PDF of this article (289 KB)

Through an inventory of New Zealand dams, Alistair McKerchar, Ude Shankar, and Murray Hicks have mapped water storage patterns and have begun to investigate the ecological effects of holding back the flood.

Water harvesting involves storing floodwater in reservoirs for irrigation or stockwater during dry periods. Such storage ranges from small farm dams to large reservoirs servicing districts. But what are the cumulative effects of water harvesting on the freshes and floods that naturally maintain the physical habitat and vitality of stream channels?
We have begun an inventory of dams around New Zealand, identifying those used mainly for water harvesting. We have developed an index of how this storage depletes the flow regime in channels downstream, and have begun to identify mechanisms and examples of how the downstream channels can be affected.
First, find your dams
We began our project with the Ministry of Commerce’s New Zealand dam inventory; prepared to help identify hazards posed by large dams, it lists details of 483 dams but omits many smaller dams. Using their resource consent databases, regional and unitary councils helped us to expand the list to include more than 2000 additional dams. For some councils, however, small dams are a permitted activity for which no resource consent is necessary, and therefore these councils have no information about small dams. The Northland Regional Council, for example, estimated that there were at least 2000 structures throughout its region for which no building or resource consent was held. Also, not all councils have been able to respond to this request to date, and thus the list is deficient for the Gisborne, Marlborough, and Taranaki regions.
For the purposes of this study, water-harvesting dams were taken to include irrigation dams, farm stockwater dams, and water supply dams. We excluded hydroelectric dams and other dams normally kept full, and flood-control dams, which are normally empty.
Then devise a water-harvest index
A simple index of how water harvesting affects river flow regimes is the ratio of cumulative upstream storage volume to natural mean runoff. This gives the time taken to fill all of the reservoirs upstream by the average flow in the stream. This quantity can also be interpreted as the average time that a unit of water is retained in storage, or residence time. For example, water in a stream with annual mean flow of 1 m3/s entering a reservoir with a storage volume of 2.6 million m3 will take about 30 days to fill and spill through the reservoir. A 30-day average residence time indicates that the reservoir has a large capacity to absorb flood flows, and so the channel downstream would experience a diminished flow regime with damped floods. Conversely, a 30-minute residence time would mean that the reservoir would have little impact on the flow regime downstream of the reservoir.
After mapping the dams from our inventory, we used GIS techniques to estimate mean runoff through each stream segment of the country’s stream channel network and to accumulate the storage volume provided by all reservoirs upstream of each stream segment. Where councils were unable to supply storage volumes for dams, we estimated this, either from regional relationships between reservoir volume and reservoir area or dam height, or simply by assuming a regional average storage volume. With this information we calculated and mapped the water-harvesting index (or cumulative reservoir residence time) for each stream segment.
Regional patterns of the index

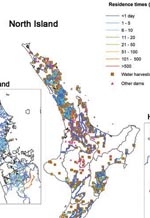
Although the national coverage is not complete, the interim mapped results reveal interesting regional patterns and contrasts. The water-harvesting index is coded by colour. The highest index values, shown in brick red and red, exceed 100 days residence time and correspond to interception of more than 25% of the annual runoff. These occur for:
- the Hoteo River, an important regional water resource just north of Auckland
- streams below the Auckland water supply dams in the Waitakere and Hunua Ranges
- small streams in the Moutere area between Nelson and Motueka
- tributaries of the lower Hakataramea River in South Canterbury (where runoff is very low)
- rivers in Central Otago, notably the middle and upper reaches of the Taieri River and the eastern tributaries of the Manuherikia River. (This is the lowest rainfall region in the country, and there are many stockwater and irrigation dams, including several with large capacities, such as the Loganburn Dam.)
Streams with medium residence times (6–100 days, corresponding to interception of approximately 1–25% of runoff) are shown in green and orange. They occur in Northland (particularly around the Kerikeri area and in the Mangakahia River basin), around Auckland, Hawke’s Bay, near Motueka, near Waipara in North Canterbury, in north and Central Otago, and in some minor instances near Westport and Hokitika.
Elsewhere, there is little effect evident. However, with only large-dam data available for Taranaki, Gisborne, and Marlborough, our current maps may not accurately depict the situation in these areas.
Despite seasonal soil-moisture deficits, most Canterbury rivers are mapped as having only minor effects. This is because groundwater in Canterbury is often a readily available resource that is cheaper to develop than constructing a dam. The Waipara region, however, with limited groundwater and a water-harvesting scheme dating from the 1970s, does have a high index.
Potential effects of depleted flow
What effects can a flow regime depleted by water-harvesting have on stream environments? Where the water is extracted from the streams only during flood flows, the effect on normal and low flows should be minimal. However, it is the flood flows that do the work of maintaining the channel’s morphology and substrate, keeping its coarse-sediment load moving downstream, flushing fine sediment from the banks and pools and within the substrate, and controlling the encroachment of riparian vegetation. If large floods return frequently enough with respect to the growth rate of woody plants, such as willows, the flow has a good chance of clearing the immature vegetation from the banks or islands. But if floods are damped in size, the vegetation has a greater chance to gain ascendancy so that the channel may become choked and narrower. Gravel and sand may build up on the bed, particularly where tributary streams join a main channel. Such an accumulation of sediment may affect habitat quality and may also mean a reduced sediment flow out of the river mouth, with effects on shoreline erosion.
We are currently studying these issues. We aim to better determine the role of flood size and frequency on stream channel maintenance, then model the cumulative effects of upstream reservoirs on flood size. Ultimately, we will develop tools to help decide how much water harvesting across a catchment is permissible before irreversible change is caused to the river environment, or at least to fairly recognise the downstream environmental effects of water-harvesting.
Holding back the flood
- Floodwaters are often stored in reservoirs to supply irrigation and stockwater during dry times.
- This project maps the effect of water harvesting on natural flows downstream of the dams.
- Ecological effects can include changes to vegetation, habitat, and movement of sediments.
Further reading
Ministry of Commerce. (1997). New Zealand dam inventory. Ministry of Commerce, Wellington. 36 p.
Dr Alistair McKerchar, Dr Ude Shankar, and Dr Murray Hicks work on sediment processes. The authors are all with NIWA in Christchurch.
This study is supported by FRST as part of the ‘Water Allocation: Protection of Instream Values’ programme.
Author contact: [email protected]
Teachers’ resource for NCEA AS: Biology 90483 (2.9); Geography 90207 (1.6), 90331 (2.1), 90336 (2.6), 90701 (3.1); Science 90313 (2.2) See other curriculum connections at www.niwa.co.nz/pubs/wa/resources
