PDF of this article (299 KB)
Michael Uddstrom, Hilary Oliver, Phil Andrews, Stuart Moore, and Vanessa Sherlock explain how state-of-the-art meteorological forecasting supports a raft of models for the hazards caused by weather.
Weather drives New Zealand’s most frequent and damaging natural hazards. While the weather can cause direct damage through, for example, snow, rain, and high winds, it has much wider secondary effects in the form of floods, damaging waves, storm surge and coastal inundation, landslides, and erosion. Forecasting of these hazards depends on accurate weather forecasts. Timely forecasts can be used to make decisions that save lives and property and reduce the hazard’s impact on people and property.
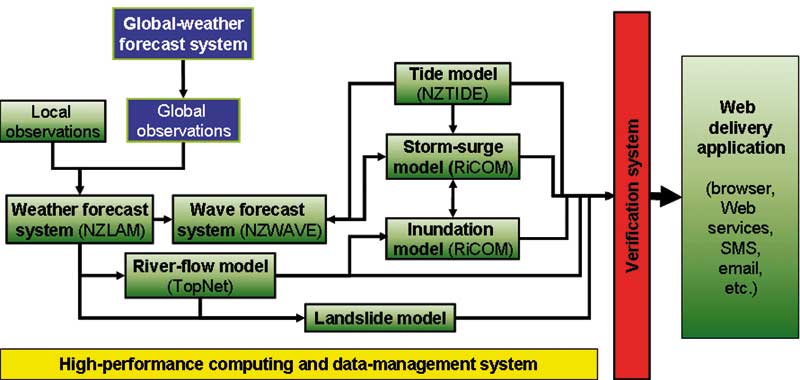
Scientists at NIWA use a weather-forecast model to feed a network of environmental forecasting models. The weather model (NZLAM) provides meteorological inputs to a river runoff forecast model (TopNet), which in turn provides river-flow forecasts to an inundation model. The same weather-forecast model also provides wind and surface-pressure forecasts to wave and storm-surge models (NZWAVE and RiCOM), leading to forecasts of sea-level height. The flow diagram, bottom right, shows how these (and other environmental models) are linked at NIWA.
Weather prediction science
While predicting the weather remains a difficult problem, the method for improving the accuracy and reliability of a weatherforecast model is well understood. The requirements are: more and better meteorological data, better ways of incorporating these data into forecast models, high-resolution numerical models that can simulate all the important atmospheric processes and interactions with New Zealand’s mountainous terrain, and a powerful supercomputer.
First, get your data
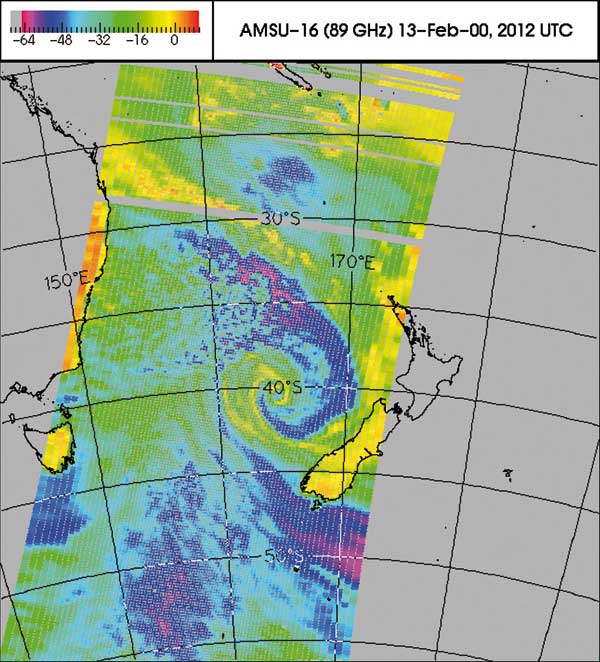
New Zealand’s location provides an ideal opportunity to exploit new satellite measurements of radiation emitted by atmospheric gases. These measurements provide information related to atmospheric temperature, cloud liquid water, water vapour, and rain over oceanic areas. The image right shows the coverage possible from just one radiation channel from one pass of the NOAA15 polar-orbiting satellite. Thanks to investment in satellite instrumentation by agencies such as NASA, NOAA, EUMETSAT, and JMA, coupled with NIWA’s investment in satellite-reception facilities, we now have access to millions of satellite observations every day.
Next, choose your model
The research challenge is to determine how to use these complex data (that is, emitted radiation rather than, say, temperature or pressure) to improve forecast accuracy. To date, few high-resolution weather-forecasting systems have been capable of using these satellite observations. An exception is the Met Office (UK) Unified ModelTM system (UM). The UM is at the leading edge of weather-forecast system development, and our research is using it to develop a high-resolution, data-assimilating weather-forecasting model for the New Zealand region – the New Zealand Limited Area Model (NZLAM). NZLAM can also assimilate conventional weatherstation observations, including those from ships, buoys, weather balloons, and aircraft, leading to the best estimate of the true state of the atmosphere at the beginning of each forecast, and hence better and more accurate forecasts of future weather.
The numerical weather-prediction model at the heart of the UM system provides the second ingredient needed to improve forecast accuracy. This model is capable of forecasting the evolution of the atmosphere over very complex terrain at a spatial resolution of less than a kilometre. Taken together these two features (data assimilation and the high-resolution model) improve forecast accuracy, especially with regard to forecasting the timing and intensity of weather events. To ensure that forecasts are useful to 48 hours ahead, it is necessary to track entire weather systems and model the atmosphere up to 35-km height over a very large part of the earth’s surface (15 000 000 km2 in the case of NZLAM).
Combine and compute
The remaining requirement is a supercomputer to provide enough processor power and enough memory (about 50 GB) to calculate forecasts much more quickly than the weather evolves. Each forecast for the next 48 hours uses 216 processors on NIWA’s Cray T3E 1200e supercomputer for around 75 minutes, and generates more than 4.5 GB of data per forecast.
A model outcome
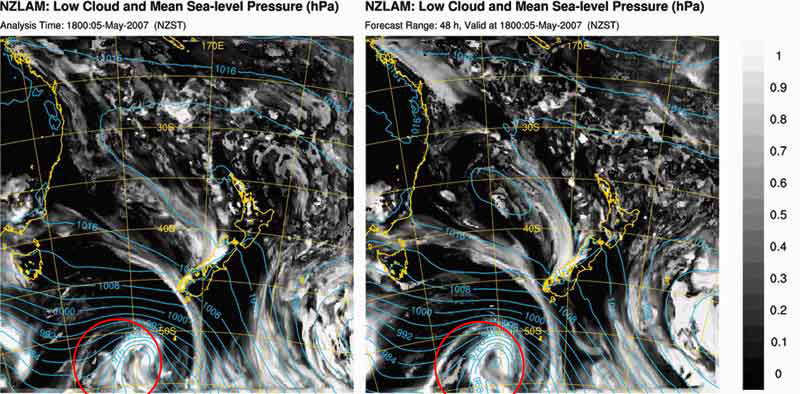
The two panels right show an analysis (our best estimate of the ‘truth’) and a 48-h forecast of mean sea-level pressure and low cloud for the same time. These elements can be used to identify surface fronts. Differences between the left panel (the ‘truth’) and the right panel (the 48-h forecast) indicate forecast errors. Clearly, many features are nearly identical, indicating a reliable and accurate forecast. NZLAM is able to forecast the comma clouds associated with low-pressure systems (such as the one circled in red) and the effects of the Southern Alps on the surface pressure and cloud fields. All of these advantages lead to NZLAM’s ability to reliably forecast significant weather events many hours in advance.
Now we are focused on gaining a fuller understanding of forecast-system accuracy; making even better use of satellite data (including experimenting with 4-dimensional data assimilation); exploring the power of NZLAM at still higher spatial resolutions; and re-analysing data from the severe storm events of February and July 2004 and May 2005. These research strands will help us understand how the NZLAM’s new capabilities can lead to better weather forecasts in the future and to better forecasts of natural hazards, such as river flood and storm surge.
Hazarding a forecast
- New Zealand’s storm, flood, coastal surge, and landslide hazards are all driven by the weather.
- Accurate weather forecast models are the basis for predicting many natural hazards.
- Earth-bound and satellite data, state-of-the-art weather models, and grunty computing combine to power an ‘all-hazards’ network of models.
Dr Michael Uddstrom, Dr Hilary Oliver, Phil Andrews, Dr Stuart Moore, and Dr Vanessa Sherlock study meteorology, remote sensing and numerical weather prediction. They all work at NIWA in Wellington.
Teachers’ resource for NCEA Achievement Standards or Unit Standards: Weather Level 2 US20159