What is the UV Index (UVI)?
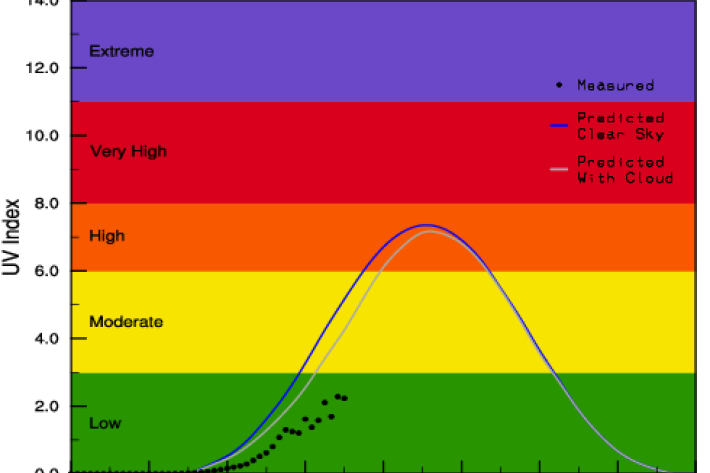
The UV index (UVI) is a standard measurement of erythemal (sun-burn causing) UV intensity that gives a more objective measure than the old “time to burn” (which cannot account for skin tone). The scale is open-ended, but a UVI of greater than 10 is extreme and a UVI of less than 3 is low. For clear skies, the UVI depends mainly on the sun elevation angle and the ozone amount.
The UVI also depends on cloud cover, sun-earth separation, altitude, pollution, and surface reflections (e.g., snow cover). The highest values in the world occur in the tropics at high altitudes, where the UVI can exceed 25. The geographical and seasonal variation in peak UVI for New Zealand can be viewed below. In the NZ winter, the UVI rarely exceeds 3. Because of differences in ozone, sun-earth separation and pollution, the peak UVI in NZ is approximately 40% greater than at comparable latitudes in the Northern Hemisphere.
Geographical and seasonal variation in peak UVI - NZ (PDF 16KB)
Measured UVI at specific New Zealand sites
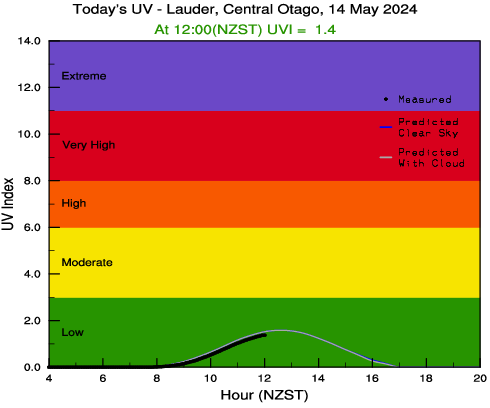
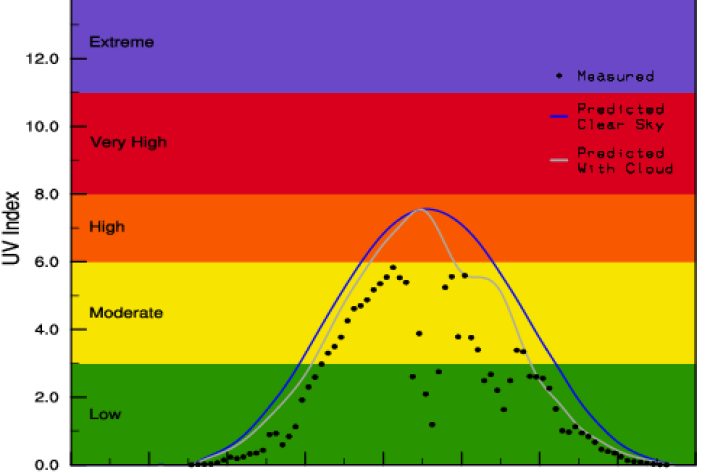
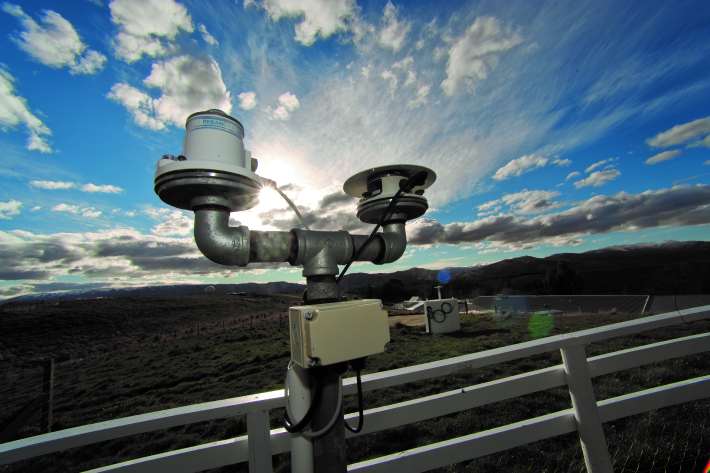
View graphs showing today's predicted and measured UVI at several sites in New Zealand. The measurements, which are from UV monitors maintained by NIWA, are updated at 15 minute intervals. The model predictions include forecast cloud effects.
View graphs with yesterday's UVI values.
See the "Data availability" section further down this page for various UVI, ozone, UV radiation, and total radiation data sources.
Today's UVI forecasts
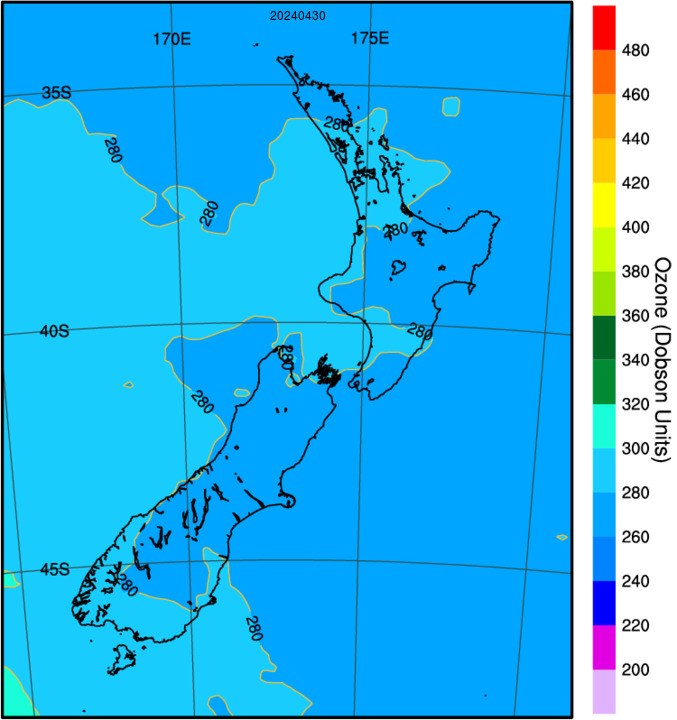
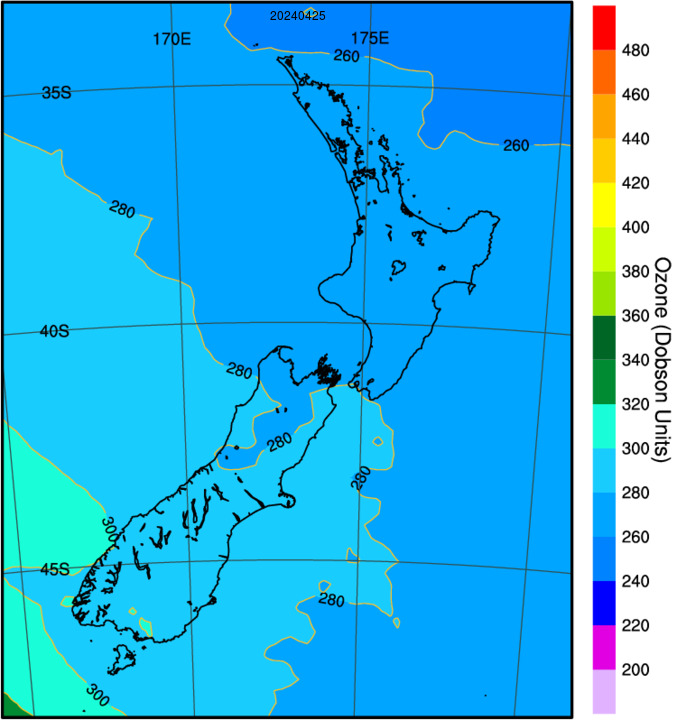
Maps showing forecast UVI and ozone for the whole of New Zealand for noon (12:00 NZST, 0:00 UTC) can be found at the links below. The forecasts are modelled using available satellite ozone data.
| Yesterday | UV Index Clear Sky | Ozone |
| Today | UV Index Clear Sky | Ozone |
View graphs showing UVI forecasts for specific sites in New Zealand and the South Pacific region.
When the UVI is low (less than 3), the World Health Organisation recommends that no protection is required and short exposures to sunlight will be beneficial for vitamin D production. At all other times some protection to avoid sunburn is recommended. The "UV Sun Protection Alert Period" is defined as the period when the clear sky forecast is greater than UVI = 3, a level at which damage to fair skin can occur in less than 1 hour. However, a recent publication showed that even when the UVI is less than 2, damage to fair skin can occur for exposure periods less than 2 hours. When the UVI = 12, damage to fair skin can occur in less than 15 minutes. For darker Polynesian skin types the safe exposure periods can be doubled. Further details on UV and health are provided by the Health Promotion Agency's Sunsmart and the Cancer Society's Sunsmart Schools.
UVI data for developers
NIWA's API for UVI (ultraviolet index) forecasts allows developers access to a time series of UVI forecasts as well as various UV data charts and images.
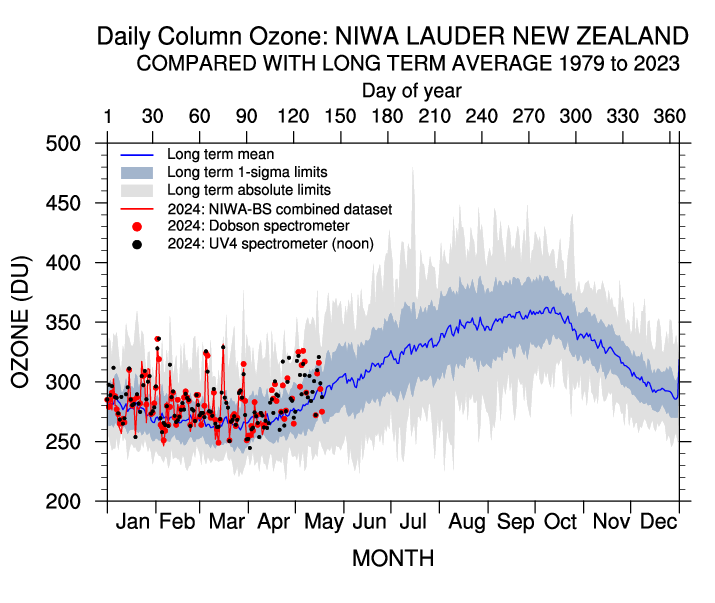
Lauder ozone
A graph of daily ozone measurements at Lauder over this year compared with past years (climatological variability). Ozone column amounts are measured in Dobson Units (DU), where 1 DU = 2.69 x 10¹⁶ molecule/cm2.
Data availability
- Ozone, cloud transmission, total radiation and various biological weightings of UV radiation can be extracted for approximately 100 sites in the New Zealand region using the NIWA UV Atlas.
- Erythemally-weighted UV irradiances (UV Index values) from Lauder and several other sites in the New Zealand region can be extracted from the NIWA Climate database. Select Datatype/Daily and Hourly Observations/Sunshine and Radiation/UV radiation to access historical 10-minute mean UVI values. These data are available from the same sites as plotted above for Yesterday's UVI, as specified in the site-selection menu. Download a detailed explanation of the calculation of UVI for MED (Minimal Erythemal Dose). [PDF 800KB]
- UV radiation data (and trace gas data) from Lauder compared with other global sites can be accessed from the international Network for the Detection of Atmospheric Composition Change (NDACC).
- Other radiation data, including aerosol optical depths from Lauder compared with other global sites can be accessed from the international Baseline Surface Radiation Network.
- UV data from Lauder compared with other North American locations can be accessed from the US Department of Agriculture.
Assessments of ozone depletion and its effects
NIWA scientists contribute to regular international assessments of ozone depletion and its environmental impacts, as required under the terms of the Montreal Protocol on Protection of the Ozone Layer. These assessments include responses, in simple layman's terms, to Frequently Asked Questions (FAQs).
- Our understanding of the science of ozone depletion is assessed by the World Meteorological Organisation (WMO) Scientific Assessment Panel.
- The environmental impacts of ozone depletion and its interactions with climate change are assessed by the United Nations Environment Programme's Environmental Assessment Panel (UNEP EEAP).
Scientific Assessment of Ozone Depletion: 2018
NIWA contributes to the four-yearly global assessment of ozone depletion led by the World Meteorological Organization (WMO) and United Nations Environment Programme (UNEP).
Read the Scientific Assessment of Ozone Depletion: 2018 report (published in full February 2019). [PDF 45MB]
Measurements from NIWA’s atmospheric monitoring station at Lauder are the only Southern Hemisphere data available in several key parts of the report, underscoring Lauder’s position as the leading observatory of its kind in southern mid-latitudes.
The latest report shows that the ozone layer is continuing to recover. However, the leading ozone depleting substance, CFC-11, is declining more slowly than expected, due to continuing illegal emissions from East Asia.
This information is provided by NIWA free of charge and can be used only for personal use. Repackaging and on-selling in any form is prohibited.
-
Yesterday's UV Index
Plots of UV levels throughout the day at different locations. -
UVI forecast for Specific Sites
Check out UV index forecasts for locations in New Zealand (including ski fields), Australia, the Pacific and Antarctica. -
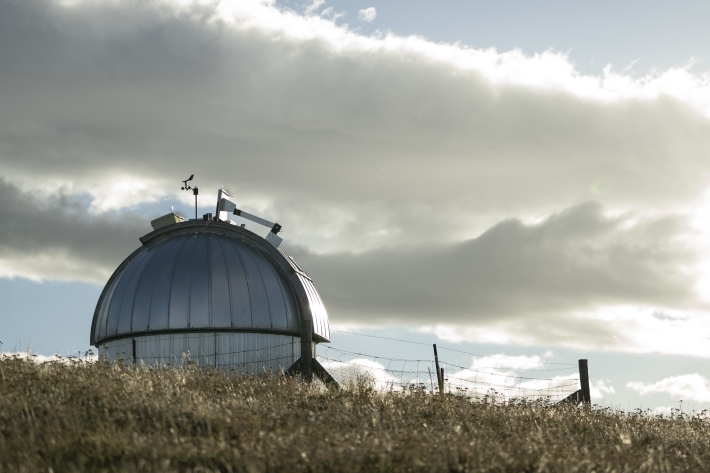
UVI at Lauder
This information is provided as part of our UV Ozone service, which also includes ozone and UV maps for New Zealand, yesterday’s forecast and measured UV, UV Atlas software, and more. NIWA has also developed an instrument to measure UV levels and display the UV Index on an easy-to-read dial. This is intended for use at swimming pools, outdoor sports events, and so on. The measured UV Index can be affected by cloud cover at Lauder. -
Real-time UV Index displays
NIWA has developed a real time UV display in consultation with the Cancer Society and Sunsmart. -

UVI smartphone apps
Several apps that provide forecasts of the UV index (UVI) are available for smartphones.