A SolarView example
1. Roughly determine the amount of solar energy collected from a photovoltic panel over a year
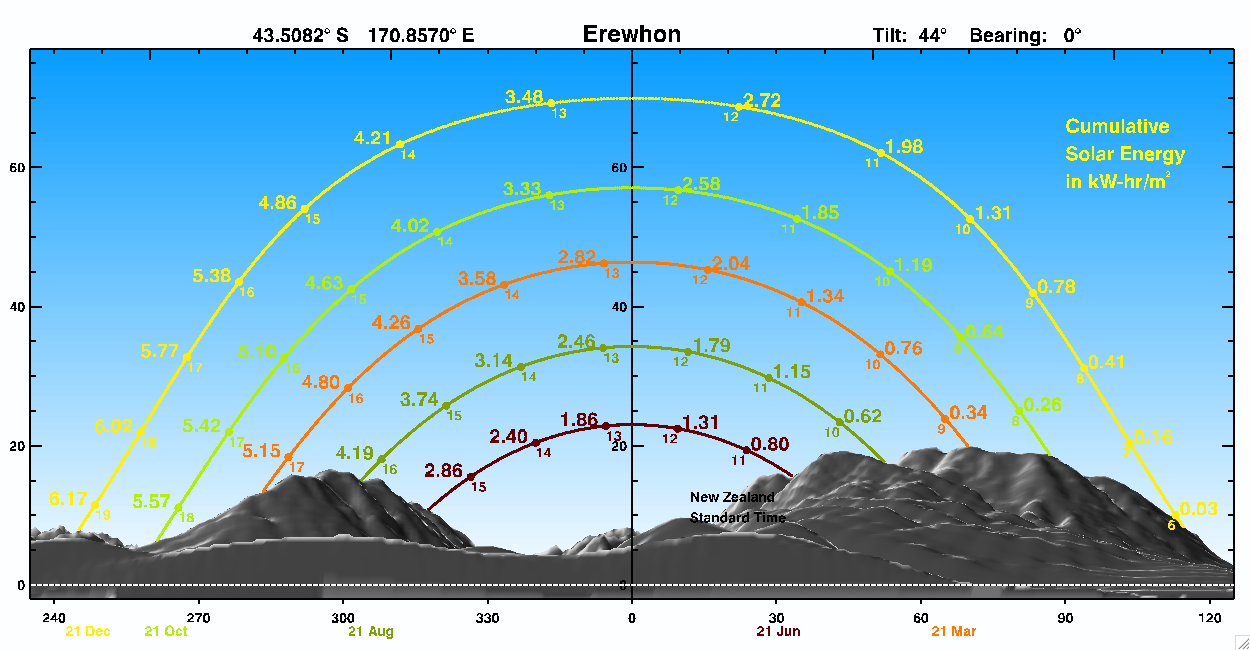
In the example below the solar panel has been ideally positioned to be North facing with a tilt of 44°. Using the graphic, we can estimate the accumulated amount of sunlight recieved on each of the five days presented:
- 21 Mar - 5.25 kWh/m²
- 21 Jun - 3.04 kWh/m²
- 21 Aug - 4.29 kWh/m²
- 21 Oct - 5.61 kWh/m²
- 21 Dec - 6.20 kWh/m²
Since these dates are spread evenly through the year, we can roughly estimate the annual sunlight absorbed at the location by multiplying the daily average by 365 days i.e. (5.25 + 3.04 + 4.29 + 5.61 + 6.20)/5 × 365 = 1780 kWh/m²/y.
In this example we're using photovoltaic panels to convert this sunlight into electricity. These typically convert about 9% of the energy into electricity*, hence the amount of energy recovered would be approximately 160 kWh/m².
If the house had a 1,000W photovoltaic array (about 8.33 m² of solar panel), then the amount of electricity collected for the year would be approximately 1,335 kWh.
2. Determine the impact of a large tree in the back garden
If there are objects shading the solar device (e.g. trees, buildings, etc) these can be drawn on the plot to calculate the energy that needs to be subtracted as a result of the period that they cast a shadow on the collector - see the example below.

* A typical 120W solar cell, generally has a surface area of just over 1m², and generates 120W when exposed to peak sunlight (~1370W/m²) i.e. ~9% efficiency.