NIWA has been engaged in an active UV research programme since the 1980s. The cornerstone of this work is the routine accurate measurement of the spectrum of surface UV irradiance to quantify UV climatologies, to understand the causes of UV variability (temporally and spatially), and to monitor long-term changes.
The procedures for data logging, data processing and quality control are consistent with those adopted by the Network for the Detection of Stratospheric Change (NDSC) and the World Meteorological Organisation (WMO) Scientific Advisory Group on UV spectro-radiometry.
NIWA instruments have performed with distinction at several international intercomparisons. They are operated in New Zealand by NIWA, and at other locations in partnership with NOAA/CMDL (at Hawaii and Boulder) and with the Australian Bureau of Meteorology (at Alice Springs and Darwin) and the University of Tokyo in Japan.
These high quality NIWA UV spectrometer systems are now available commercially.
Features
- Spectral UV irradiances to NDSC specifications, traceable to NIST.
- Ozone retrieval.
- Temperature-stabilized weather-proof enclosure.
- Automated control and remote data access software (windows).
- Suitable for long-term unattended operation.
- In-built calibration lamps and power supplies.
- In-built GPS for accurate timing.
- Processing outputs include several standard weightings of UV.
- Recognition of data affected by changing cloud conditions.
- Software-controlled tuning capability.
- Superior cosine response.
- High sensitivity and wide dynamic range.
- Forward and reverse scanning for accurate averaging.
- Capability of diffuse/direct measurements of spectral UV (manually).
- In-house data logging, data viewing, and data analysis software included.
- Part of a global network of quality assured UV spectral data.
- Support services available from NIWA for ongoing QA/QC.
The measurement schedule is fully programmable. In the normal mode of operation, spectral scans are performed at 5-degree steps of solar zenith angle (sza) between sza = 95° and the start of a special midday sequence. For a 2-hour period over local noon, scans are performed very 15 minutes. A further scan is made at midnight.
Instrument Specifications
| Model | Bentham, DTM300 |
|---|---|
| Type | Double Monochromators, Additive Dispersion |
| Focal length (mm) | 300 |
| Focal ratio | f/4.2 |
| Grating type | Plane Holographic |
| Ruling (/mm) | 3600 |
| Dispersion (nm/mm) | 0.675 |
| Slit widths (mm) | 1.0, 1.5, 1.0 |
| Slit height (mm) | 20 |
| Entrance optic | PTFE Diffuser (in house design) |
| Coupling | Fibre Bundle (1.95 m x 20 mm x 1.2 mm (GigaHertz)) |
| Detector | Hamamatsu R1527 or Electron Tubes 9781A |
| Wavelength range | 285-450 nm |
| Sample step | 0.2 nm |
| Normal Scan period | 272 seconds for forward + reverse scan (up to 4 different speeds can be used in each scan) |
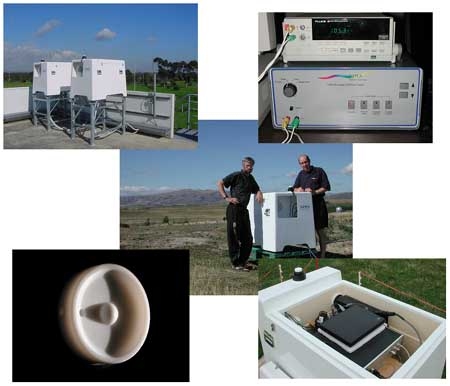
Instrument Views
NDSC Data Specifications
| Cosine response error | < ±5% to isotropic irradiance, and for all angles < 60m from the zenith. |
|---|---|
| Minimum spectral range | > 290‑400 nm |
| Band width (fwhm) | < 1 nm |
| Wavelength alignment | < ±0.03 nm (precision) < ±0.05 nm (absolute accuracy) |
| Slit function: | < 10‑3 of max 2.5 x fwhm from line centre < 10‑5 of max 6.0 x fwhm from line centre |
| Sampling step interval | < 0.5 x fwhm |
| Saturation threshold | > 1.5 W m‑2 nm‑1 (noon max at 400 nm) |
| Detection threshold | < 10‑6 W m‑2 nm‑1 (for S/N =1 at 1 nm fwhm) |
| Scan time | < 10 mins. |
| Overall calibration accuracy | < 5% (unless limited by threshold) |
| Stray light | As defined by the detection threshold |
| Temperature | Monitored, & with stability sufficient to maintain overall stability (typical stability < ± 0.5 K) |
| Scan date and time | Recorded with each spectrum (so that timing is known to within ±10 s at each wavelength) |
| Diffuse/direct measurements | Capability of distinguishing each component. |
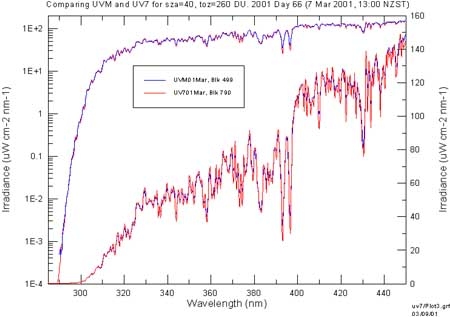
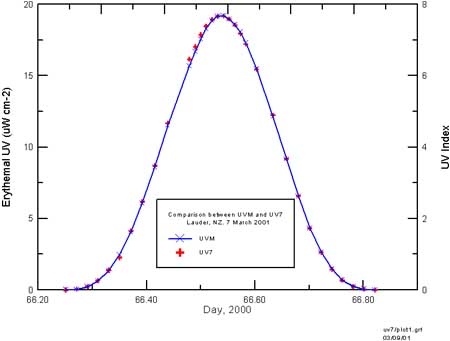
Sample Results. Comparison between two NIWA UV Spectrometers
Two spectrometers operated side by side on 7 March 2001, which was clear through most of the day. Both systems were calibrated against the FEL261 1000W standard. The results from the two spectrometers were in excellent agreement as shown by the figures below. The ozone measured by both systems was 260 ± 2 DU over the midday period.
Spectra from midday are compared below. The upper curves refer to the log axis on the left and the lower curves refer to the linear axis on the right. Note the effect of differences in spectral resolution.