El Niño Southern Oscillation: what is it?
El Niño and La Niña are opposite phases of a naturally occurring global climate cycle known as the El Niño Southern Oscillation, or ENSO for short. ENSO influences rainfall, temperature, and wind patterns around the world, including New Zealand. El Niño and La Niña episodes occur on average every few years and last up to around a year or two.
Although ENSO has an important influence on New Zealand’s climate, it accounts for less than 25 percent of the year-to-year variance in seasonal rainfall and temperatures at most locations. Nevertheless, its effects can be significant.
El Niño
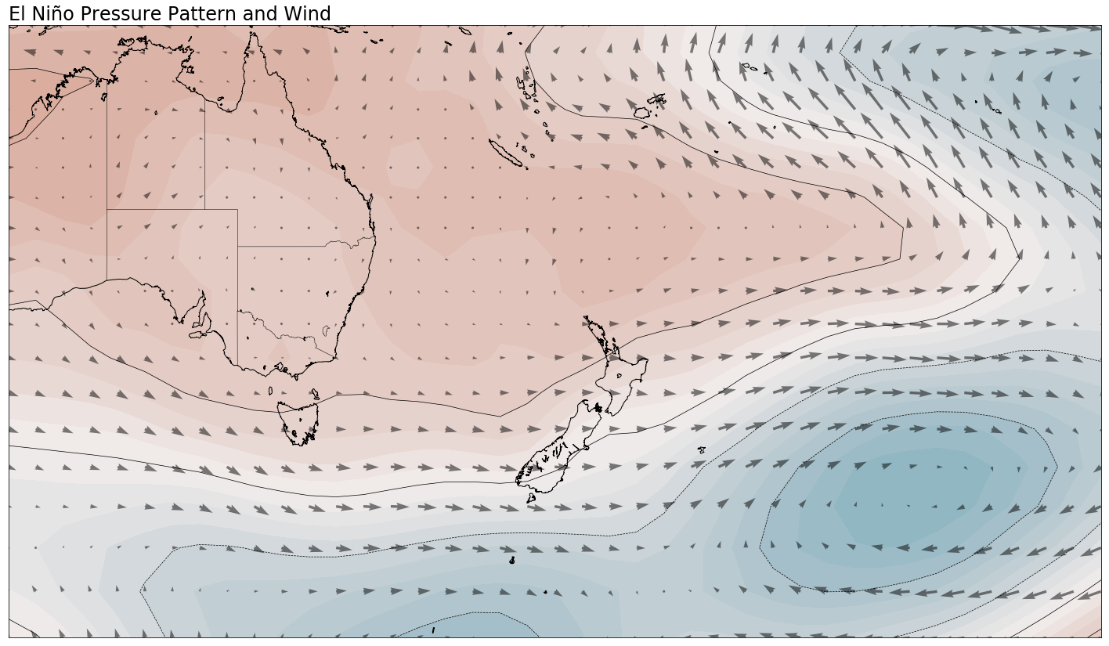
During an El Niño event, ocean water from off the coast of South America (near Ecuador and Peru) to the central tropical Pacific warm above average. The warming takes place as trade winds (the permanent east-to-west prevailing winds that flow around the equator) weaken or even reverse, blowing warm water from the western Pacific toward the east. As a result, sea temperatures in the far western Pacific can cool below average. The unusually warm water in the eastern Pacific then influences the Walker Circulation, acting as a focal point for cloud, rainfall, and thunderstorms. It is this change in the Walker Circulation that impacts weather patterns around the world.
El Niño’s average influence on New Zealand
It’s important to bear in mind that while we know the average outcome of El Niño because of historical data, no El Niño is average—each comes with a unique set of climate characteristics and therefore can be expected to influence the weather differently.
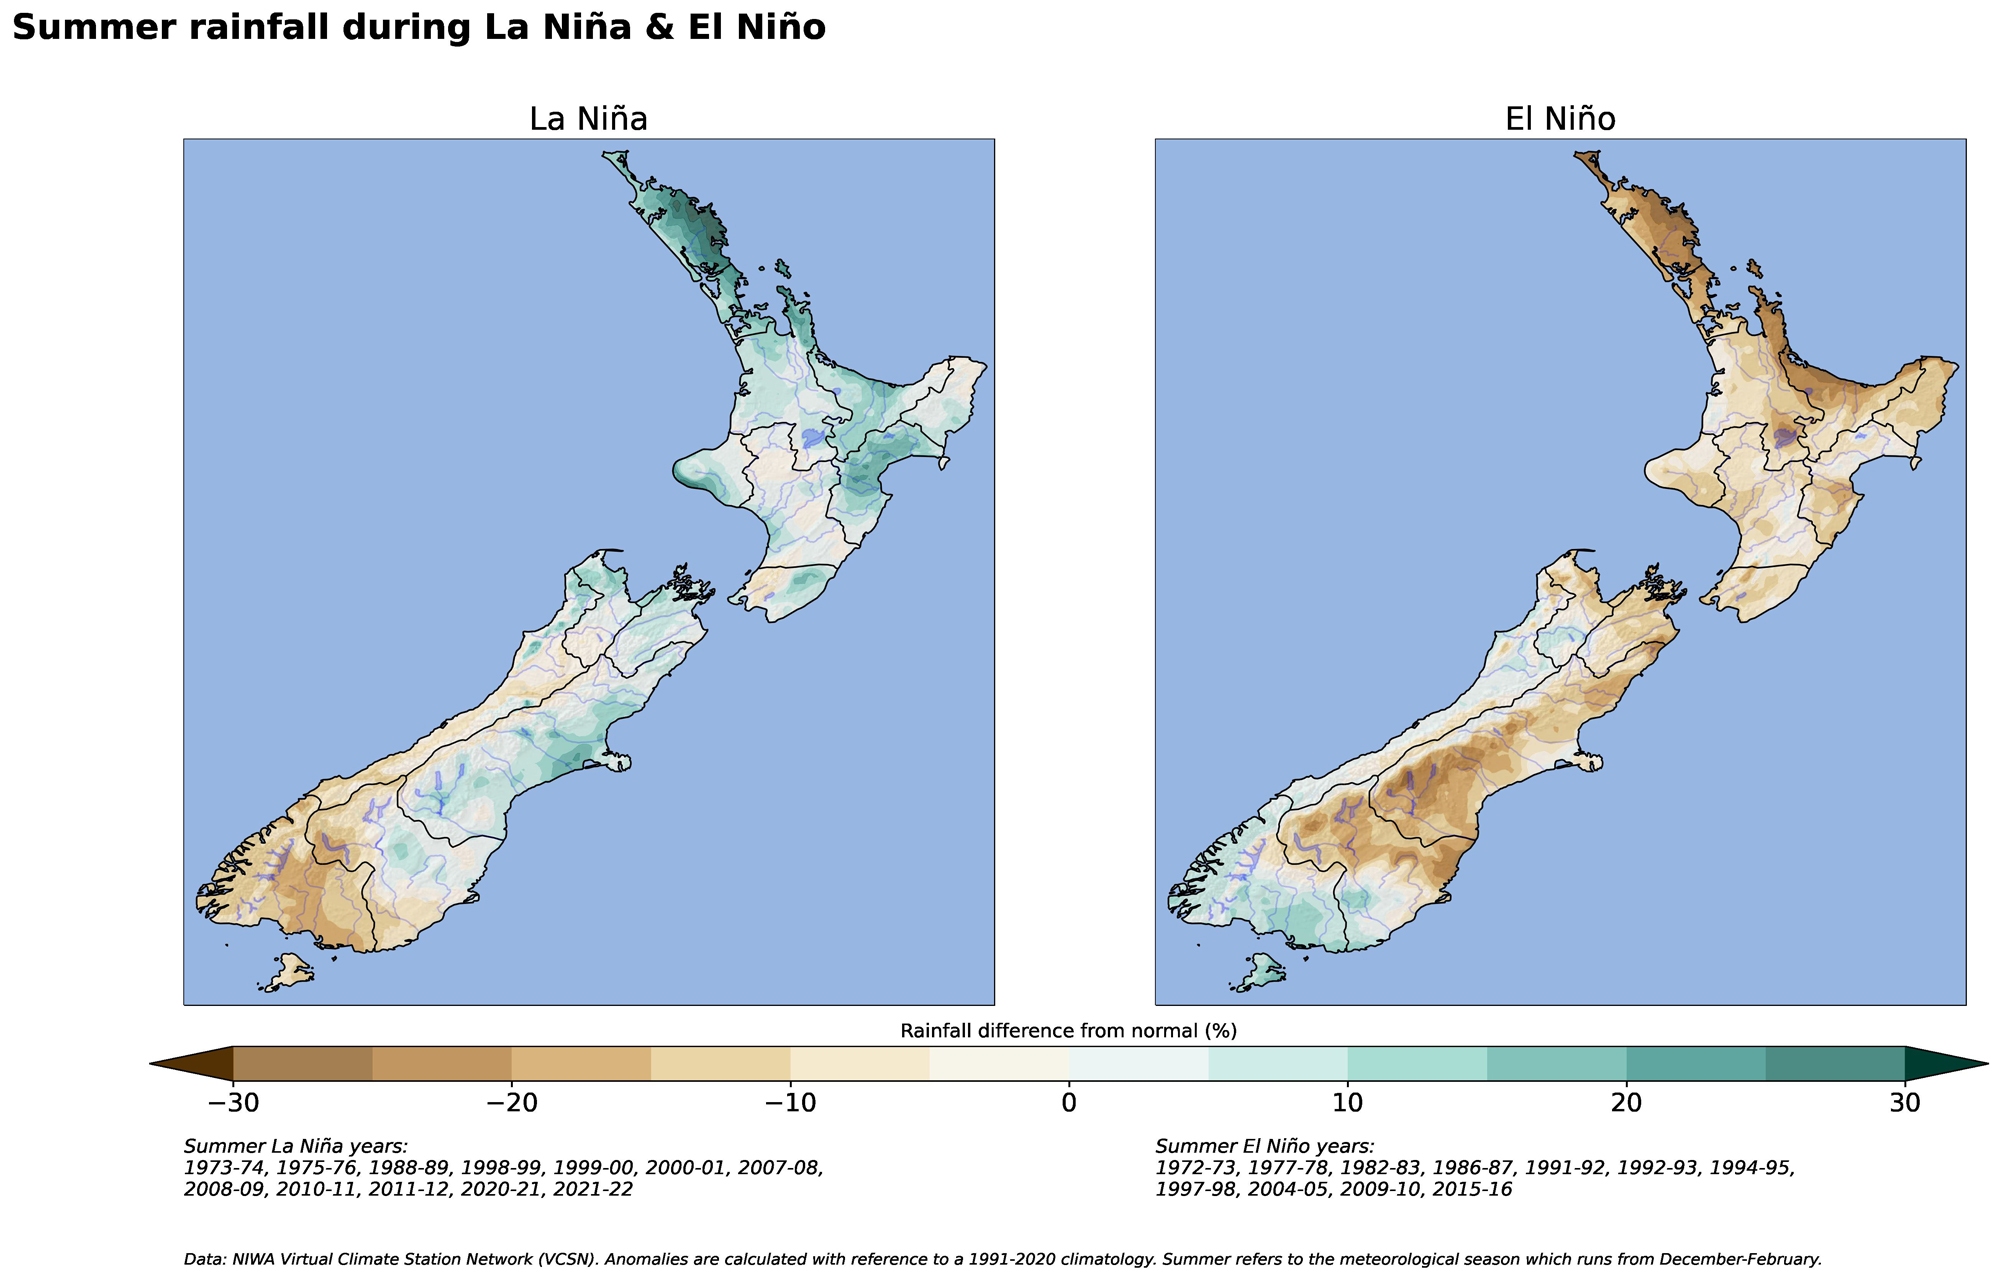
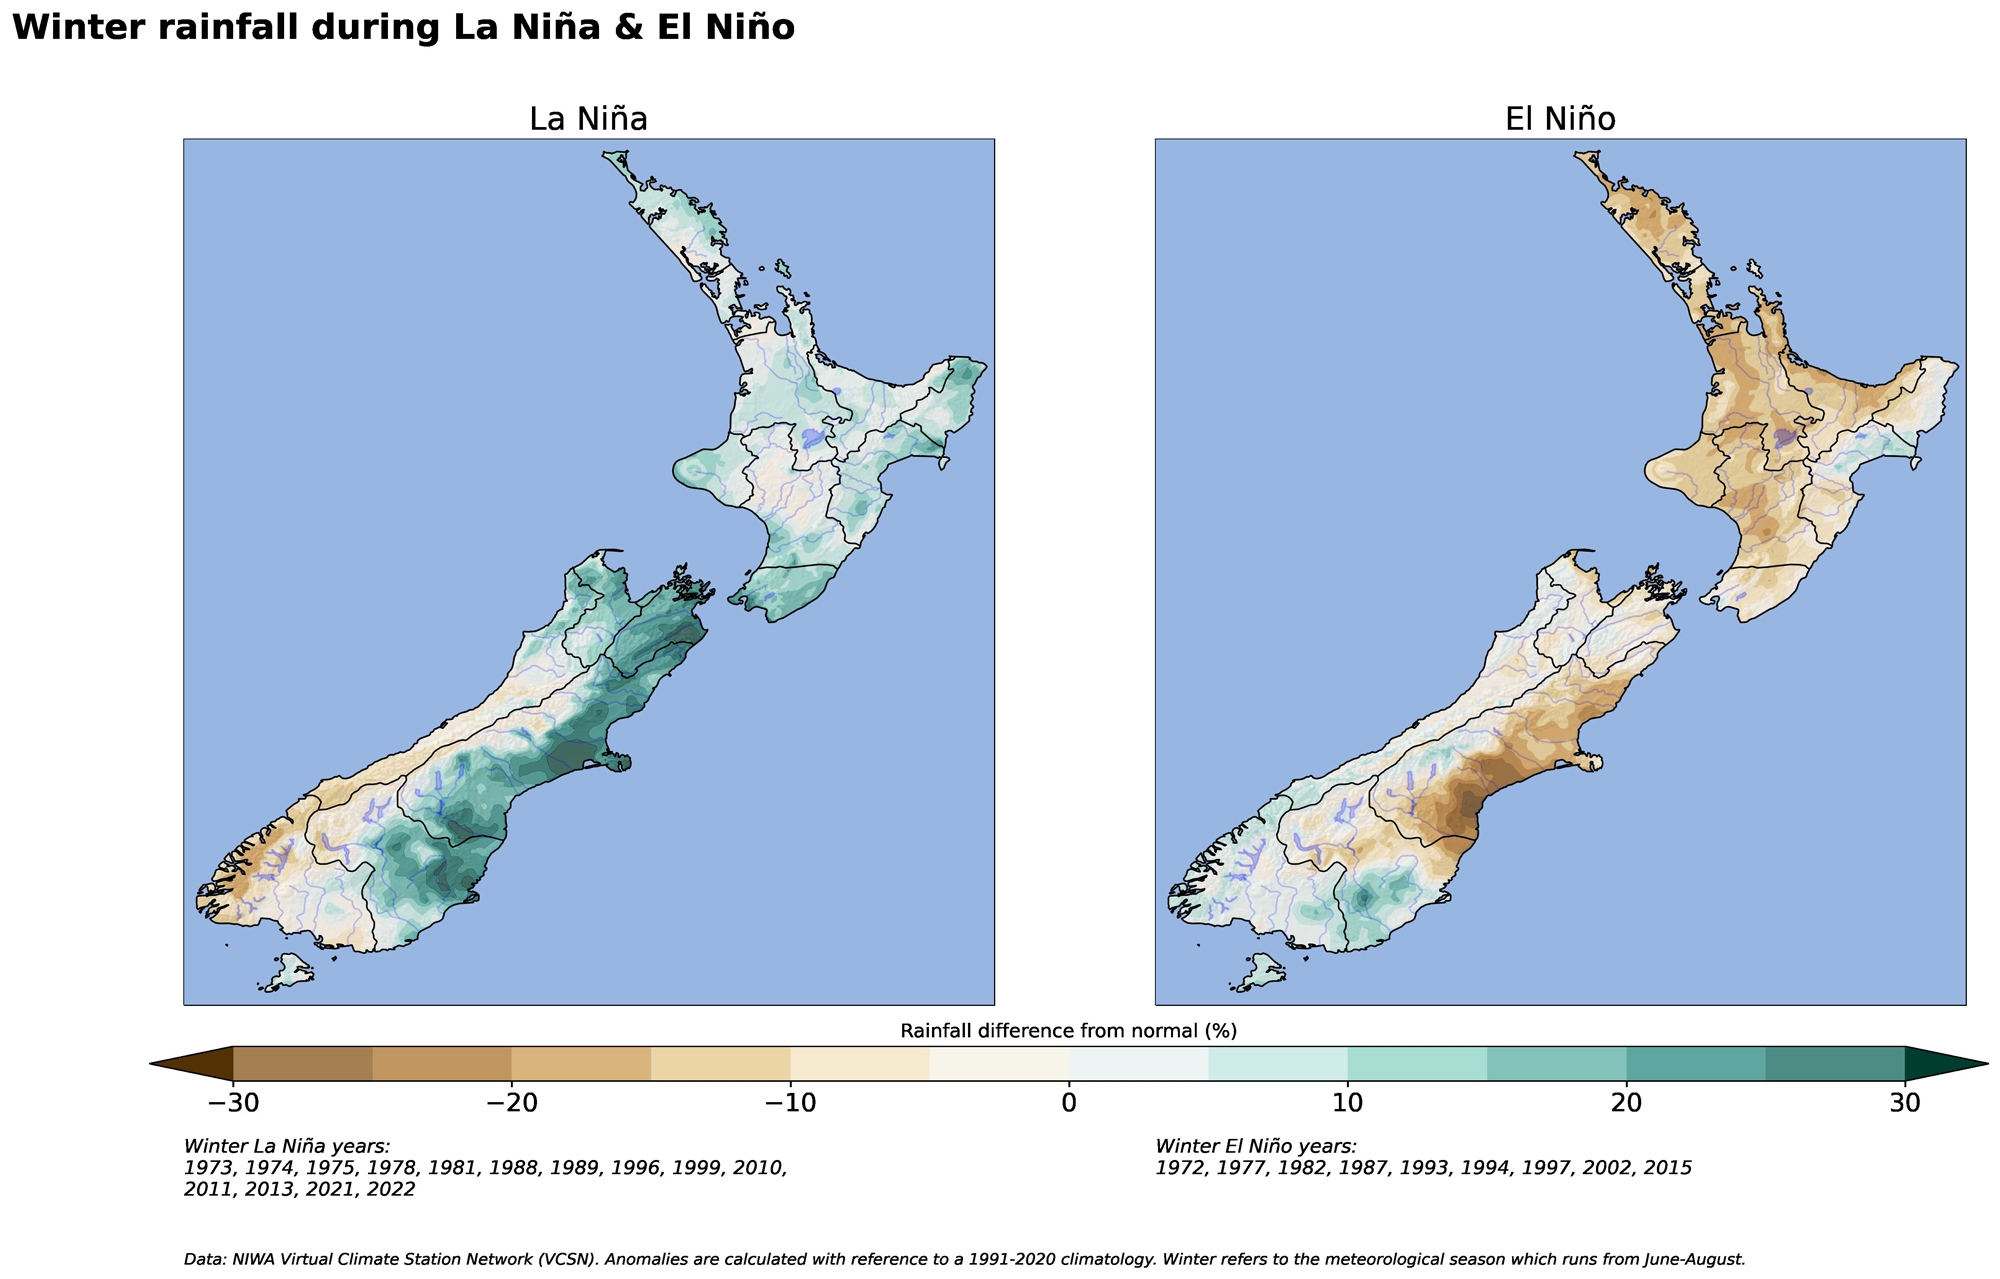
During El Niño, New Zealand tends to experience stronger or more frequent winds from the west in summer, which can encourage dryness in eastern areas and more rain in the west. In winter, the winds tend to blow more from the south, causing colder temperatures across the country. In spring and autumn, southwesterly winds are more common.
La Niña
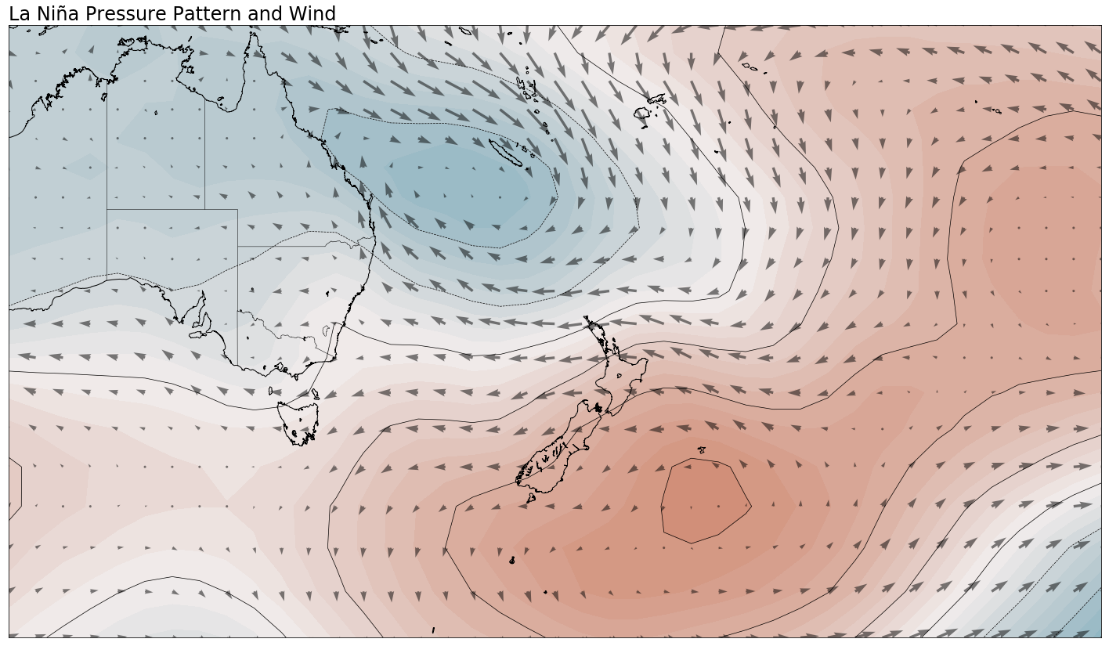
During a La Niña event, ocean water from off the coast of South America to the central tropical Pacific cools to below average temperatures. This cooling occurs because of stronger than normal easterly trade winds, which churns cooler, deeper sea water up to the ocean’s surface. Sea temperatures can warm above average in the far western Pacific when this happens. The unusually cool water in the eastern Pacific influences the Walker Circulation and suppresses cloud, rain, and thunderstorms. This change impacts weather patterns around the world, but in a different way than El Niño does.
La Niña’s average influence on New Zealand
Northeasterly winds tend to become more common during La Niña events, bringing moist, rainy conditions to northeastern areas of the North Island and reduced rainfall to the lower and western South Island. Warmer than average air and sea temperatures can occur around New Zealand during La Niña.
Monitoring ENSO in a warming climate
We are updating the way we calculate the sea surface temperature indices used to monitor and forecast the state of the El Niño-Southern Oscillation (ENSO).
This change introduces the relative Niño indices, a new method for measuring sea surface temperatures in the tropical Pacific Ocean related to ENSO. These indices offer a more accurate and consistent way to track ENSO by adjusting for the long-term warming trend in our oceans.
Unlike the traditional Niño indices which measure absolute temperatures and can overstate the frequency of El Niño events, relative Niño indices assess how unusually warm or cool the ocean is compared to the broader tropical region. Tropical rainfall patterns respond to changes in ocean temperatures. This new relative index can therefore help forecasters better determine if the equatorial Pacific is warmer or cooler than the rest of the global tropics – something which has become more challenging to discern as seas warm because of climate change. This provides a clearer picture of the ocean and atmospheric interactions that drive ENSO.
We are not changing the thresholds used to determine El Niño or La Niña events in the Southwest Pacific or the underlying data used to monitor these events. What is changing is the method of calculating the sea surface temperatures indices used as oceanic indicators of ENSO. This ensures a more consistent reflection of the ENSO status that is not biased by the long-term warming trend in our oceans.
The decision to implement relative Niño indices is based on the latest science, drawing on research published in the Journal of Climate in early 2024.
ENSO is only one part of a complex system that influences New Zealand’s climate. The Seasonal Climate Outlook is the best guide to likely rainfall and temperature outcomes for the season ahead.
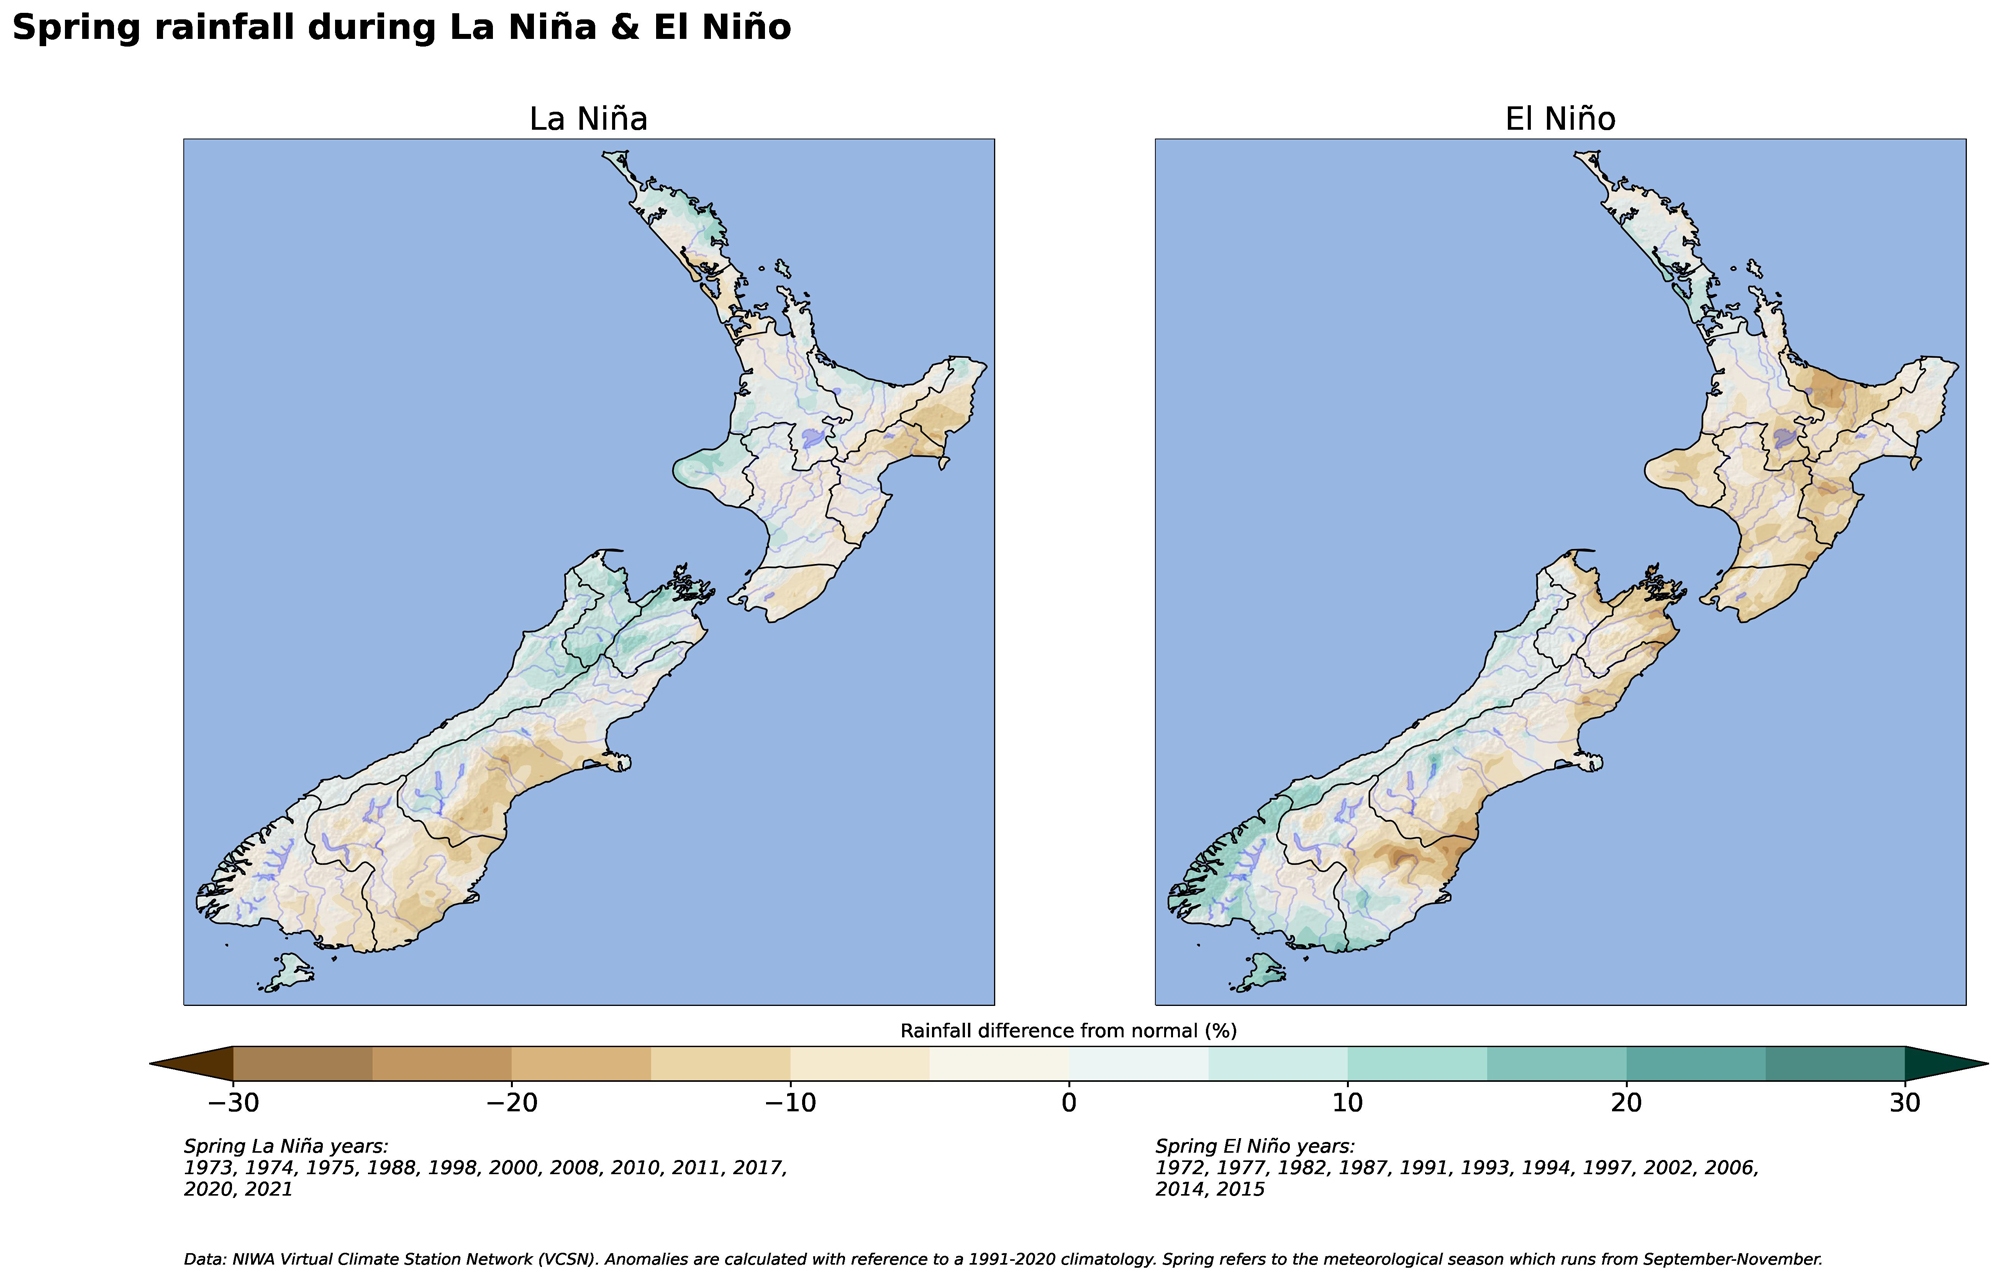
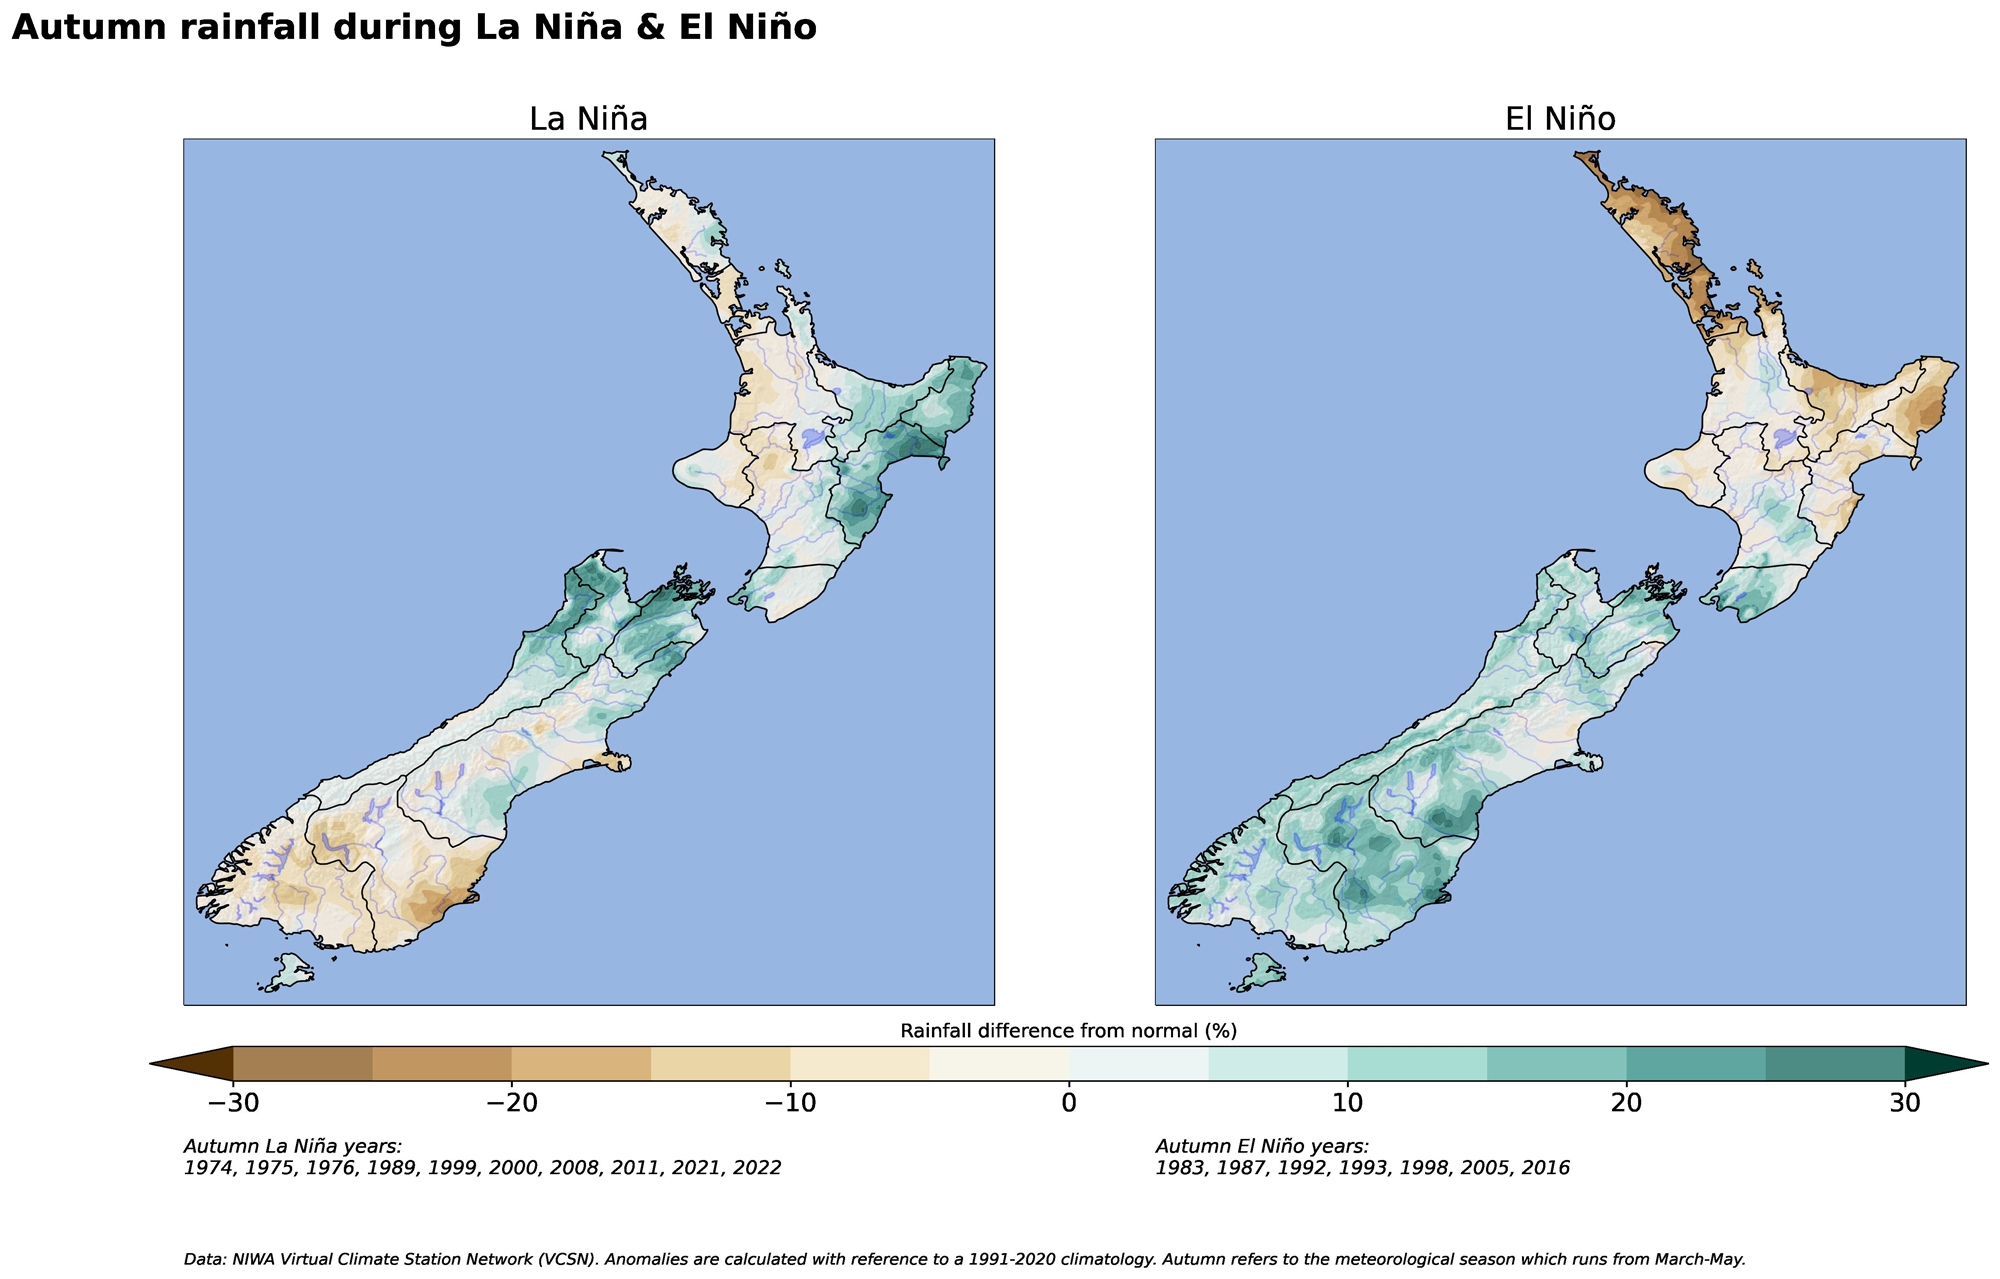
The below table and maps show historical El Niño and La Niña events and average rainfall patterns during these events.
| ENSO events | Years |
|---|---|
| Summer – El Niño | 1972-73, 1977-78, 1982-83, 1986-87, 1991-92, 1992-93, 1994-95, 1997-98, 2004-05, 2009-10, 2015-16 |
| Summer – La Niña | 1973-74, 1975-76, 1988-89, 1998-99, 1999-00, 2000-01, 2007-08, 2008-09, 2010-11, 2011-12, 2020-21, 2021-22 |
| Autumn – El Niño | 1983, 1987, 1992, 1993, 1998, 2005, 2016 |
| Autumn – La Niña | 1974, 1975, 1976, 1989, 1999, 2000, 2008, 2011, 2021, 2022 |
| Winter – El Niño | 1972, 1977, 1982, 1987, 1993, 1994, 1997, 2002, 2015 |
| Winter – La Niña | 1973, 1974, 1975, 1978, 1981, 1988, 1989, 1996, 1999, 2010, 2011, 2013, 2021, 2022 |
| Spring – El Niño | 1972, 1977, 1982, 1987, 1991, 1993, 1994, 1997, 2002, 2006, 2014, 2015 |
| Spring – La Niña | 1973, 1974, 1975, 1988, 1998, 2000, 2008, 2010, 2011, 2017, 2020, 2021 |
Useful links:
Further reading:
-
The impact of El Niño and La Niña on New Zealand's climate
El Niño accounts for less than 25 percent of the year-to year variance in seasonal rainfall and temperature at most locations in New Zealand. -

El Niño maps and charts
View a collection of maps showing the impact of past El Niño and La Niña events. -

Seasonal Climate Outlook
Publication seriesAir temperature, rainfall, soil moisture and river flow predictions for the coming season.