What is SPRAT?
The South Pacific Rainfall Atlas (SPRAT) uses the NIWA rainfall database to generate historic seasonal rainfall anomaly maps for the Southwest Pacific Islands. Historic Pacific Island rainfall data has been kindly provided by Pacific Islands National Meteorological Services (PINMS) in WMO RAV, MetService New Zealand, The Bureau of Meteorology (Australia), MeteoFrance, NOAA, and NIWA. Significant co-funding for SPRAT was provided by NOAA.
SPRAT is intended to be a resource for PINMS and for those folks wishing to learn more about the historic variability of rainfall across the Southwest Pacific.
How did we make the SPRAT maps?
Our initial assessment of the rainfall database held by NIWA in support of the Island Climate Update project identified many available rainfall stations that have operated since 1950. Some of those stations carry on to the present day. We also evaluated publically-available rainfall data in the Australia Bureau of Meteorology database and the database held by the PACRAIN program based at the Unversity of Oklahoma. A first-order analysis of station coverage for the SW Pacific region shows the 1961-1990 period contains the best time and spatial coverage across the Pacific Islands. As such, our calculations of higher and lower than normal rainfall were made with reference to that climatic normal period. In addition, all station data that were required to have >70% coverage for the climatic normal period to be deemed useful for this atlas project. This criterion meant many data series that cover time periods since 1950 but that are aperiodically interrupted or are relatively short (less than 15 years long) were excluded from our final integration. The full list of stations used in SPRAT can be found in this table.
Climatic averages for rainfall during 1961-1990 were calculated at each station at a seasonal level, and then all seasonal values were normalised with reference to the 1961-1990 average to show positive and negative rainfall departures through time. We took the seasonal normalized values and created seasonal anomalies and mapped them across the region to illustrate the large-scale rainfall distribution through time for the Southwest Pacific.
What can SPRAT tell us?
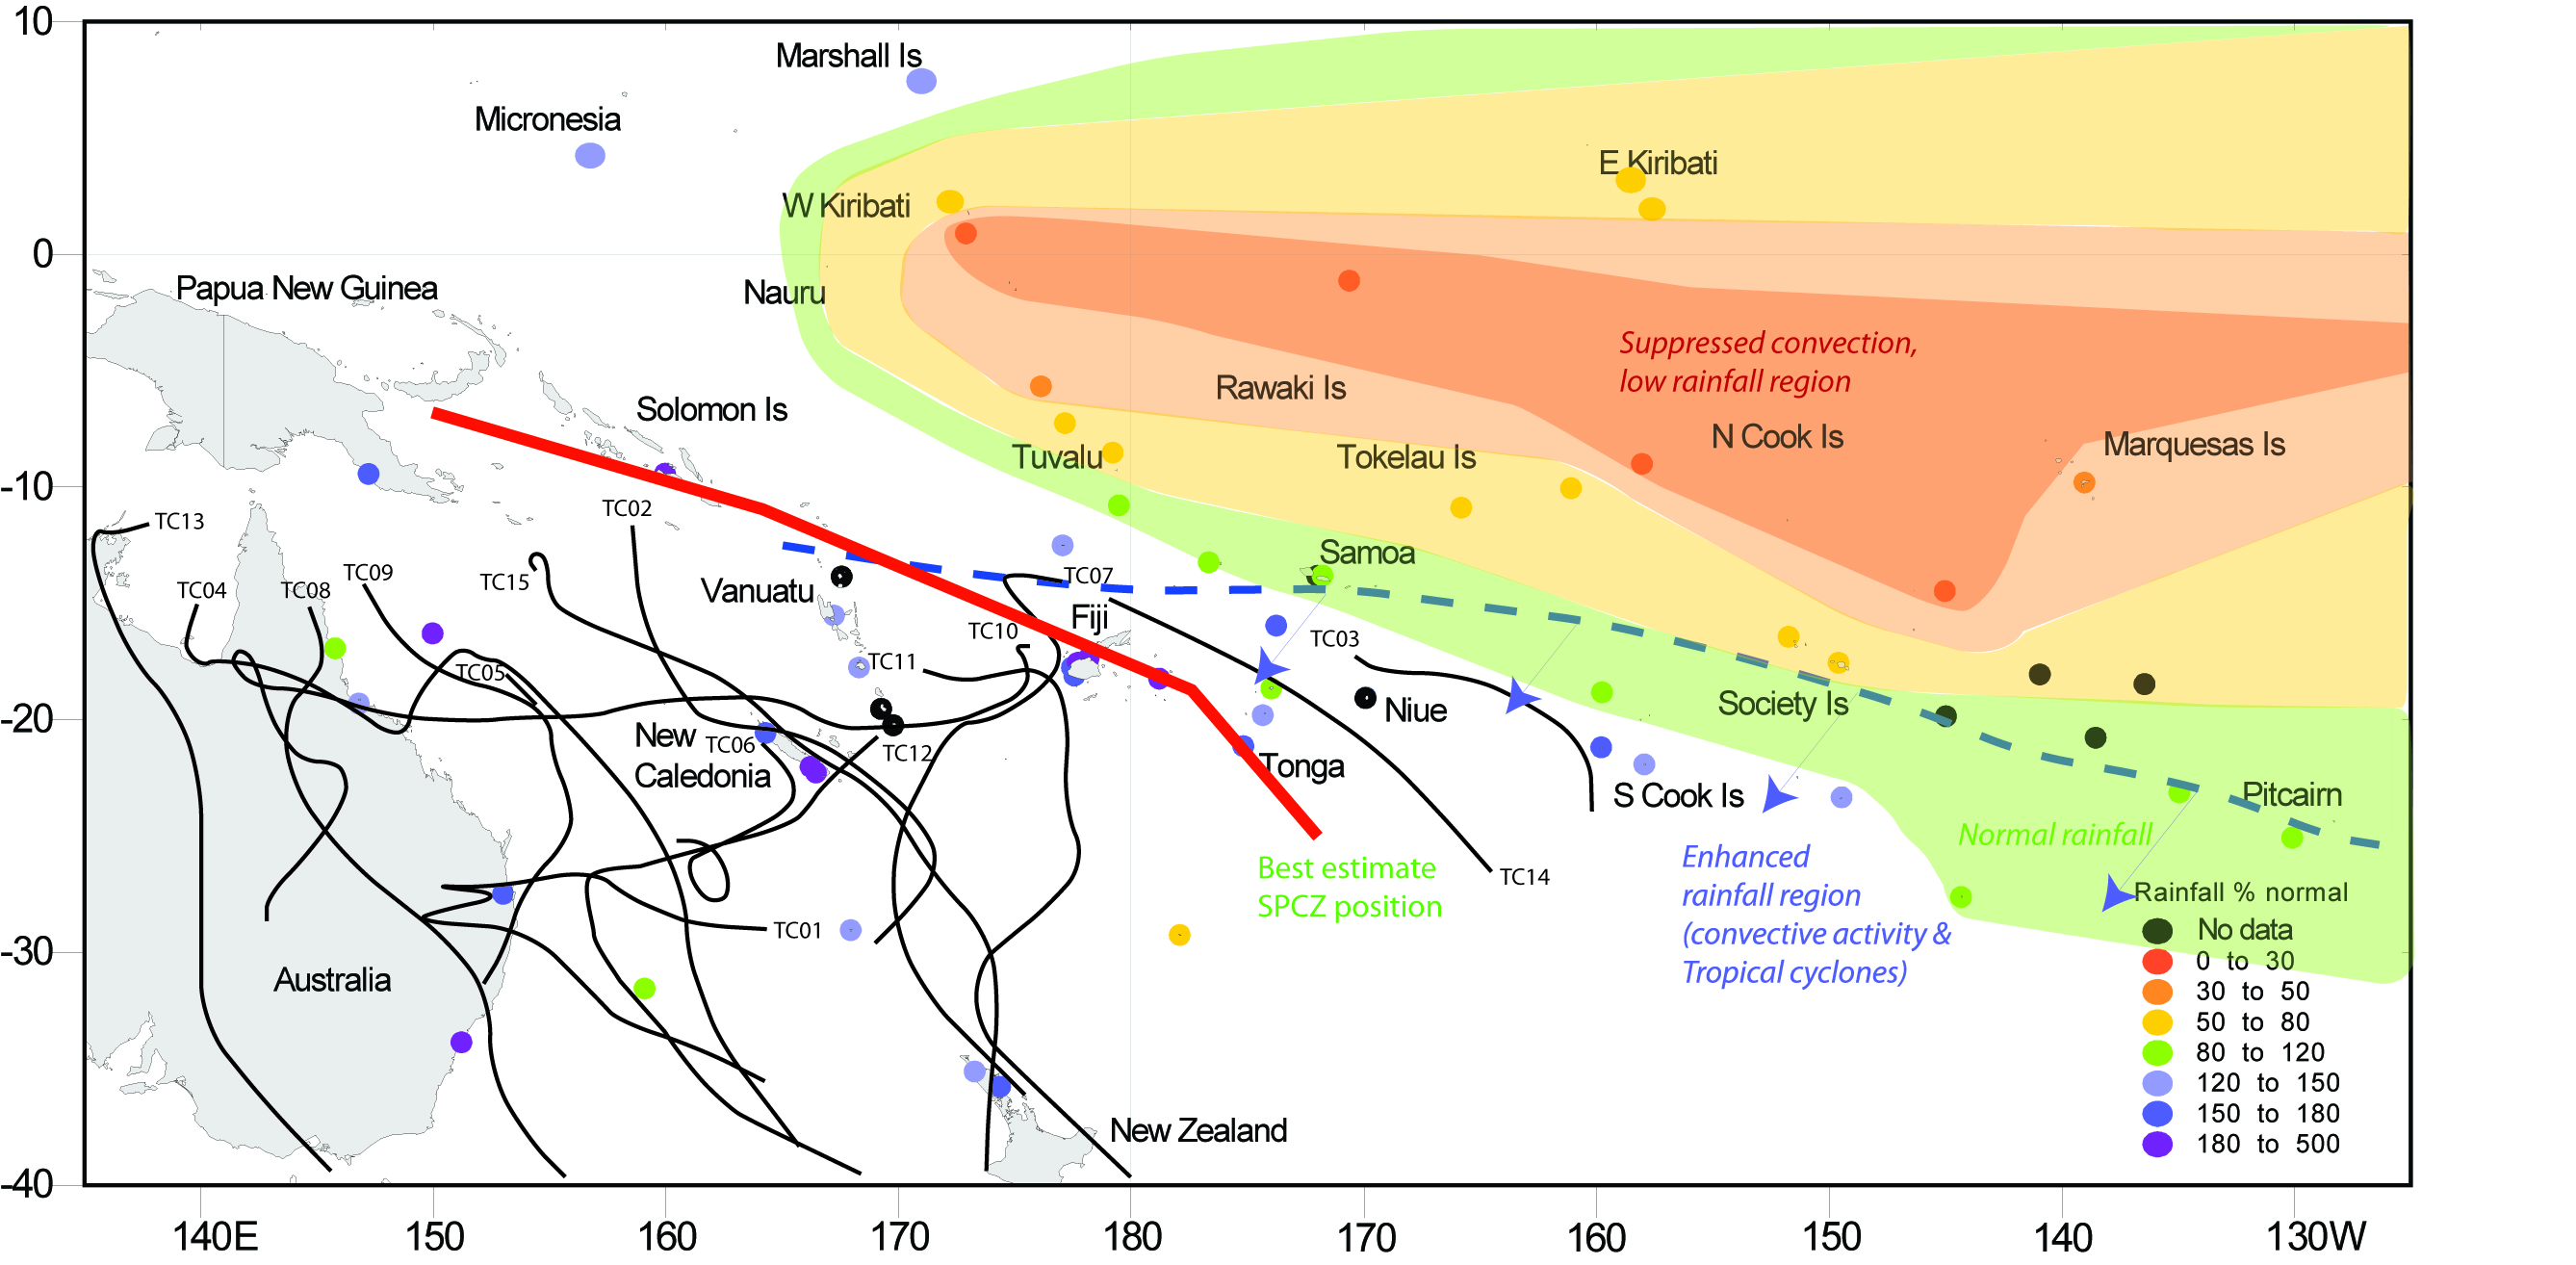
The SPRAT maps reveal coherent areas of enhanced and suppressed rainfall across the Southwest Pacific. Some of the seasonal patterns can be related to the El Niño-Southern Oscillation, the South Pacific Convergence Zone, tropical cyclone influences and other Pacific climate modes. The SPRAT maps can be used as a guide for what conditions may occur across the region with respect to different phases of ENSO. The gridded data associated with these maps may be downloaded here (soon), or requested via an email to Drew Lorrey.
What applied research has SPRAT been used in?
- The South Pacific rainfall data has been used to examine the South Pacific Convergence Zone in the pre-satellite era - this research was published in 2012 in Monthly Weather Review.
- Connections between South Pacific weather regimes and rainfall
- Palaeoclimate research with corals
- Ongoing project examining the South Pacific Convergence Zone in reanalyses