Less than a week before the official end of summer on 28 February, temperatures dropped and a cool breeze made a whistle-stop tour of the country.
But a few days – when autumn felt like a distinct possibility after weeks and weeks of sweltering heat and tepid seas – wasn’t enough to stop history. By then, the summer of 2017/18 was already the hottest on record.
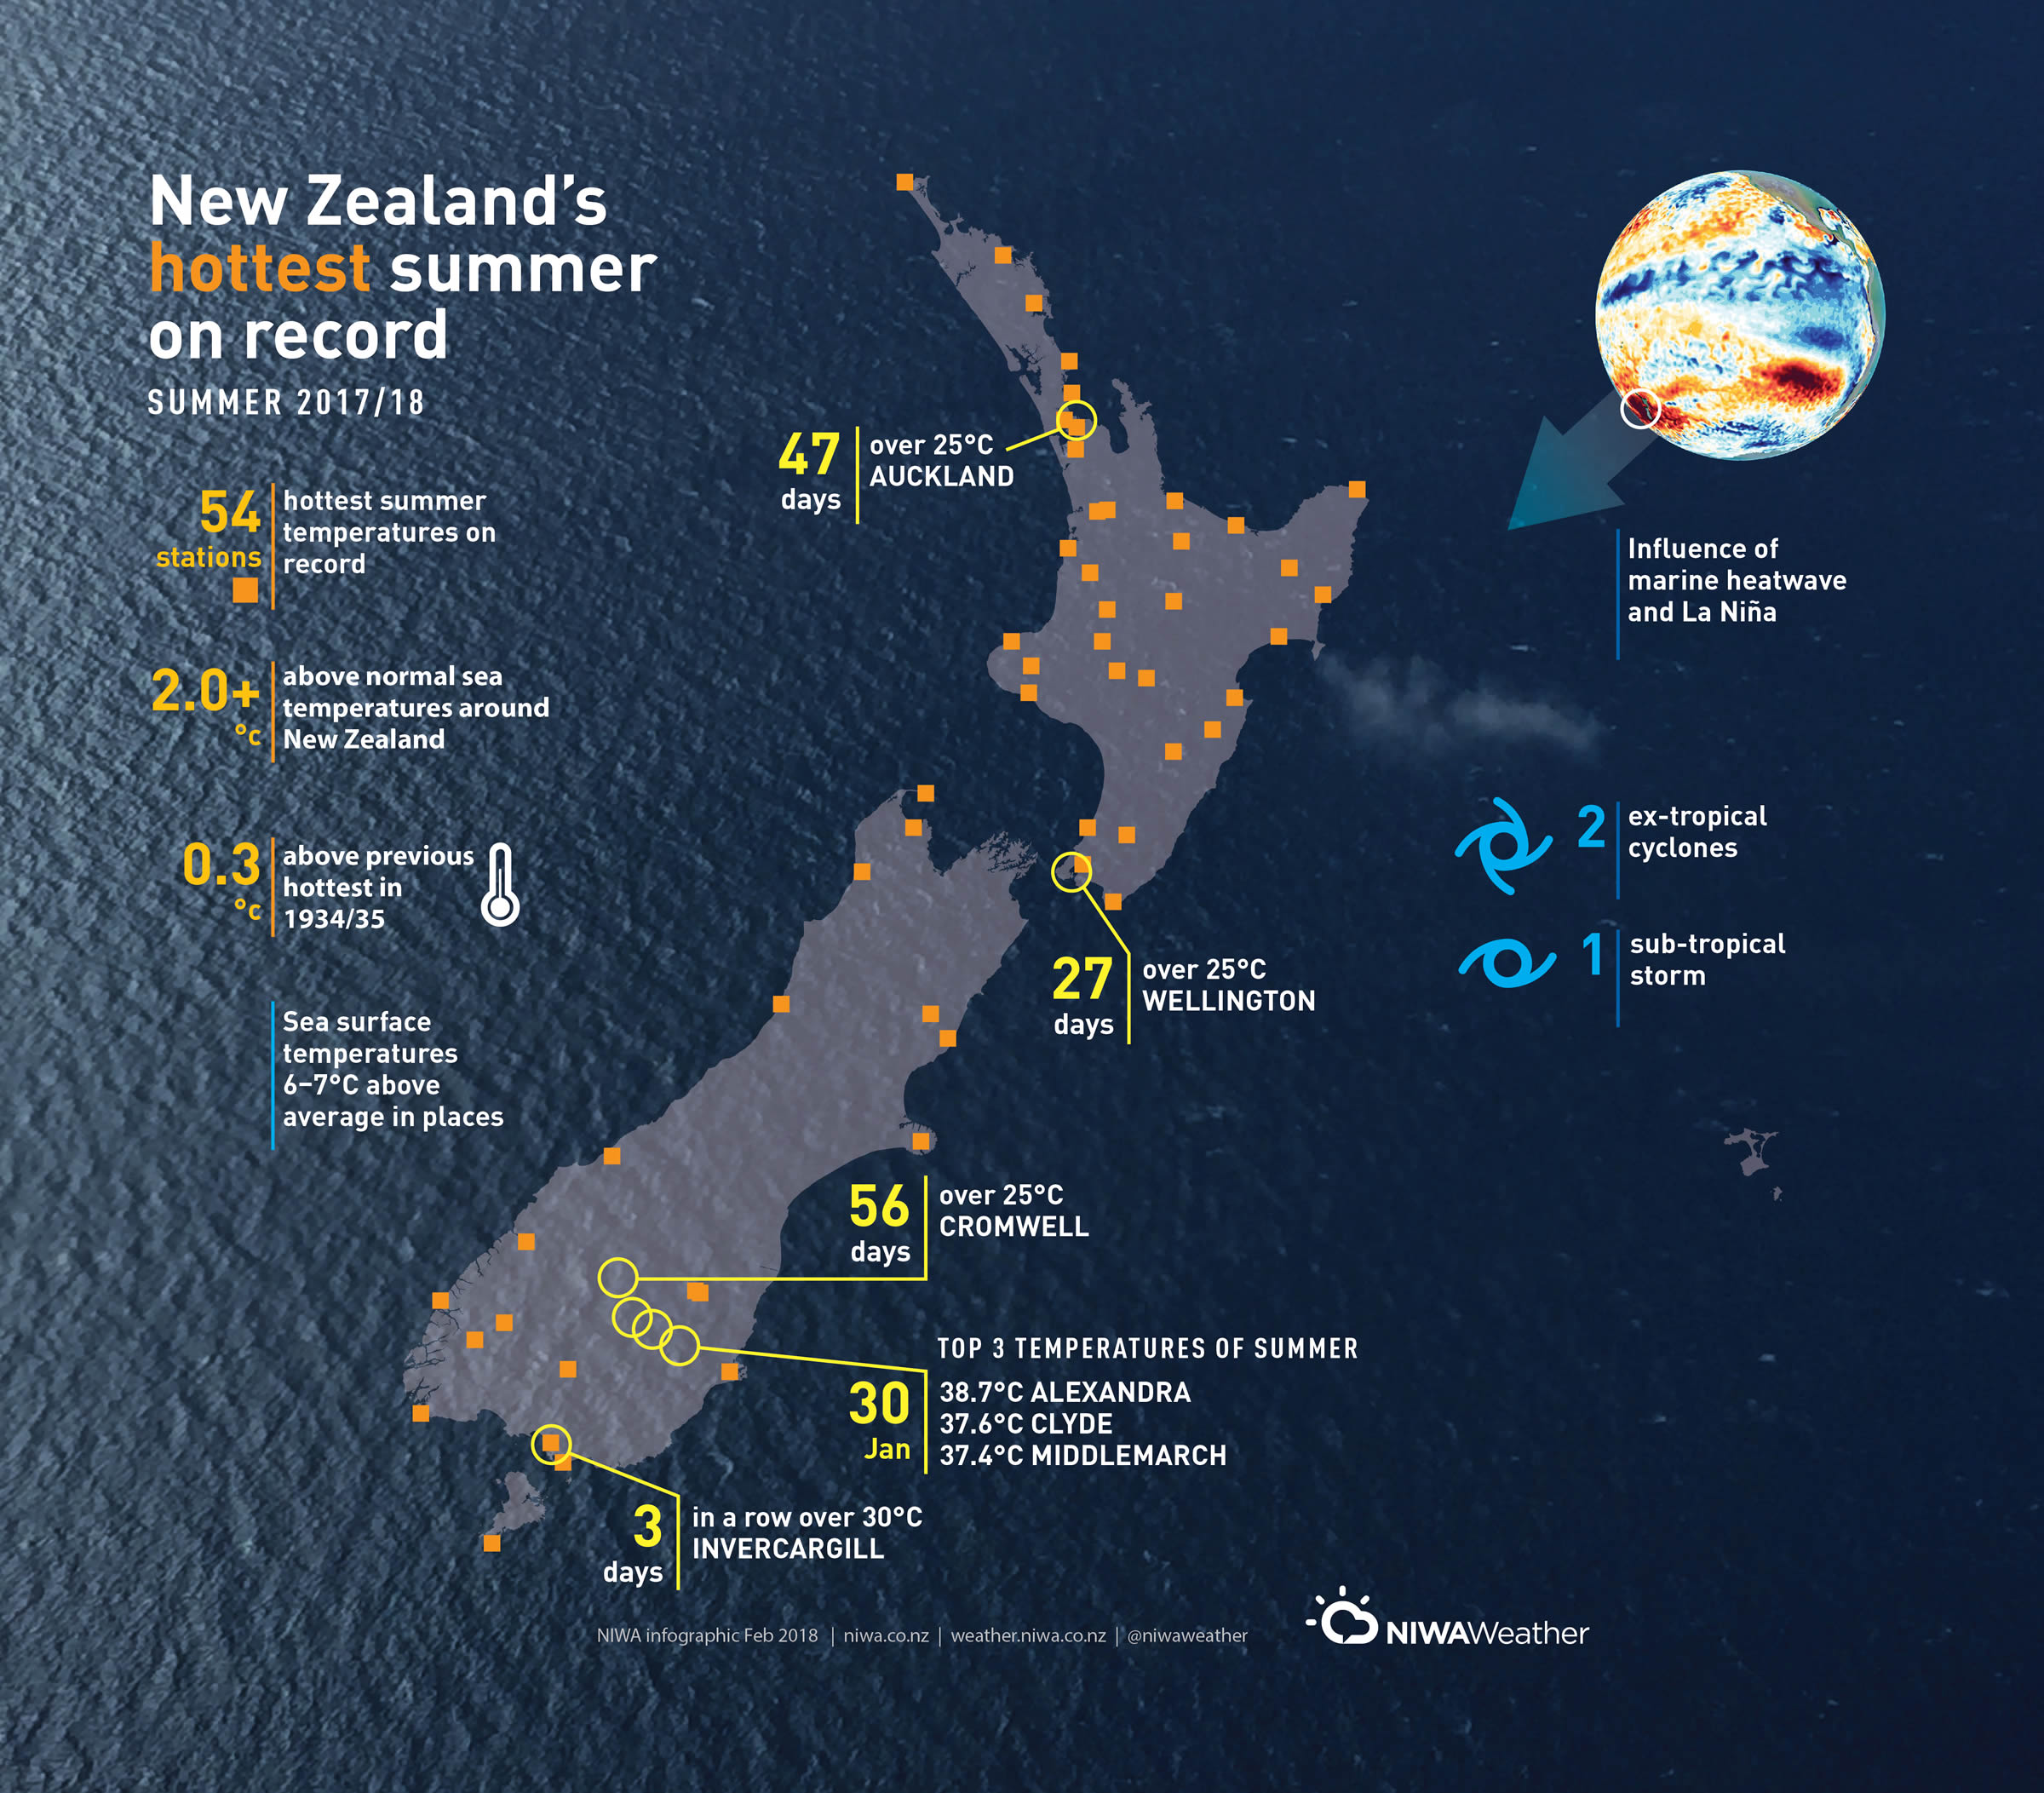
And when the final tally was in, 54 climate stations around New Zealand had recorded their highest temperatures ever.
Summer had got off to a hot start, with well-above average temperatures during December. That led into January being declared New Zealand’s hottest month on record and February experiencing two ex-tropical cyclones, Fehi and Gita, pulling warm humid air down from the sub-tropics.
Overall, the nationwide average temperature for summer was 18.8°C; 2.1°C above the 1981–2010 summer average from NIWA’s seven station temperature series, which began in 1909.
The highest temperature of summer was 38.7°C, at Alexandra on 30 January. Wellingtonians baked in 25°C or more on 27 different days (measured at Kelburn), when the norm is two a summer – but that was nothing compared with Cromwell, where the town experienced 56 days when the temperature was more than 25°C.
NIWA meteorologist Ben Noll says the driver of this summer’s remarkable warmth was the marine heatwave.
“This has been a striking feature on both a regional and global climate scale,” he says.
“It began at the end of November last year and persisted for three months. There have been three distinct peaks when sea surface temperatures were between 2°C and 4°C above average: mid-December, late January and mid-late February.”
But Noll says there were even some areas where sea surface temperatures were 6–7°C above average.
“This represented some of the largest ocean temperature anomalies anywhere in the world over the last several months.”
He says a warmer than average Tasman Sea is a signature of La Niña, because it is associated with higher than normal air pressure over the region during the late-spring and early-summer – this prevents mixing of deeper, cooler sea water with surface waters. In addition, warm northeasterly winds pushed warm water toward the country from the sub-tropics.
NIWA climate scientists have had to go back more than 80 years to find a summer that resembled anything like the one we have just sweated through. They found it in the summer of 1934/35.
That summer the temperature was 1.8°C above the 1981–2010 average (climate scientists use a 30-year period to determine statistical averages).
When delving into the record books, NIWA Principal Climate Scientist Dr Brett Mullan found that the summer 1934/35 was so unusual it prompted New Zealand Meteorological Service director Dr Edward Kidson to report on it in a special Meteorological Office Note.
Mullan says the note shows there were several similarities to this summer, including widespread drought from November to mid-February.
Kidson wrote that a “feature of the pressure distribution was that the high pressure belt and tracks of moving anticyclones were unusually far south in the New Zealand area, generally crossing the Dominion instead of passing to the north of it.”
Mullan says the persistence of anticyclones and northeasterly winds have also been a feature of this summer.
Over land, Kidson noted that “in none of the four months November (1934) to February (1935) did any station in New Zealand record a mean temperature which was not above normal”.
The 2017/18 summer records
54 stations across New Zealand recorded their hottest summer on record, 39 their second-hottest and nine their third-hottest.
In Alexandra on 30 January the temperature reached 38.7°C. On the same day Clyde got to 37.6, Middlemarch 37.4 – together these comprise the hottest temperatures of summer.
Wellington had 27 days above 25°C – the average is two.
Auckland usually has 29 summer days above 25°C (measured at Auckland Airport), this year there were 47 – the highest since records began at Auckland Airport in 1966.
Invercargill recorded three consecutive days over 30°C in January. It’s never done that for two days in a row, let alone three.
Cromwell topped 25°C for 56 days – normal is 35 days.
Dew point temperature – the meteorological measurement combining humidity and temperature – failed to drop below 19°C in Auckland between 10 and 15 February, making it a rare 115-hour period of very high humidity.
In Wellington a dew point temperature of 22°C was recorded at 6pm on 11 February, the highest dew point on record for the city.
Mahia, Appleby and Waipara West had their wettest summers on record.
How did we get a marine heatwave?
Here’s the meteorological lowdown:
In late spring and early summer an area of high pressure was almost stationary over New Zealand and the Tasman Sea, bringing plenty of sun and very warm conditions for the time of year.
That heated the top of the Tasman Sea and New Zealand’s coastal waters and, because there weren’t many storms, there was limited mixing and churning of the ocean. That meant that the colder water under the sea’s surface did not come up to the top to mix with the warmer water.
From there occurred what meteorologists call “positive feedback” – the warmth of the ocean fed the warmth on land and that in turn kept the seas warmer than average.
In addition, warmer northerly winds, a characteristic of a La Niña weather pattern, pushed warm water towards New Zealand and generally kept temperatures warmer than average.
The four primary causes
Persistent patterns of high pressure over the Tasman Sea and New Zealand
La Niña's influence of warm northeasterly winds
A persistently positive Southern Annular Mode (SAM), which limited southerly wind outbreaks
Climate change, acting as a long-term tailwind to temperatures.