Climate scientists and glaciologists are taking to the skies this week to find out how New Zealand’s glaciers are faring following this summer’s record-breaking warmth.

NIWA’s annual long-term aerial snowline survey marks its 40th anniversary this year of recording the snowline altitude of up to 50 glaciers across the South Island. The survey is undertaken every March at the end of summer and is carried out using specialised cameras from a light aircraft. The survey reveals how much of the previous winter’s snow remains to contribute to long-term glacial ice accumulation.
NIWA climate scientist Dr Andrew Lorrey, who leads the project, says the information gathered over the past four decades has produced a unique and incredibly valuable dataset that provides an independent measure of how climate change and variability are affecting our water resources.

“We look at the surface of each glacier and the line of demarcation where there is snow from the previous winter above, and exposed bare ice below. That line can tell you about the amount of snow gained versus the amount lost since the start of the glacier year in April.”
Dr Lorrey says he expects this year’s survey to reveal some “pretty pathetic” glaciers, following New Zealand’s hottest summer on record.
“We have seen preliminary photos of some of them and they look sad and dirty."
“At this time of year we can see the effects of the summer melt but following such an extreme summer the layers really start to peel back and you can see how harsh the effect has been on the glaciers. Where it becomes a concern is if there is a succession of seasons like this within a decade or two – that’s when it can cause the overall volume of the glacier to decline.”
Clear signals of climate change
Glacier fluctuations are among the clearest signals of climate change, because they are highly sensitive indicators of atmospheric temperature and precipitation levels.
Victoria University glaciologist Professor Andrew Mackintosh says he is also expecting one of the largest melt years ever recorded.
“Our team has previously investigated the relationship between the South Island glaciers and sea surface temperatures. We have seen that when the Tasman Sea is warmer than normal, you tend to lose a great deal of snow and ice in the Southern Alps.
“The marine heatwave this summer, where temperatures have been up to 6°C higher in some parts of the Tasman Sea, means we are expecting to see a much higher snow line.”

The five scientists on board the snowline flight – Andrew Lorrey and Trevor Chinn, together with Dr Huw Horgan, Dr Brian Anderson and PhD student Lauren Vargo from Victoria University, will take thousands of photos from different angles that will then be used to build 3D models of glaciers that can be compared year on year to give an accurate depiction of the volume of ice that has changed.
Prof Mackintosh says that powerful computing methods are used to process the photos, enabling precise measurement of snowlines, and the glacier surfaces. Over the 40 years of the survey, the precision has evolved to the point it now “takes the guesswork out of expert judgement”.
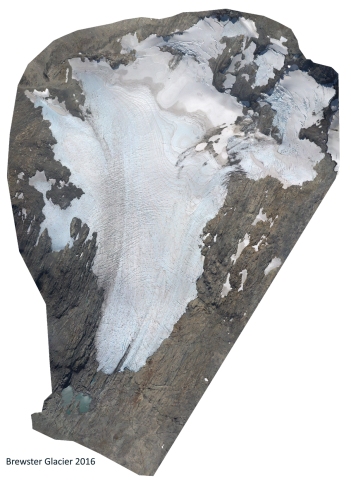
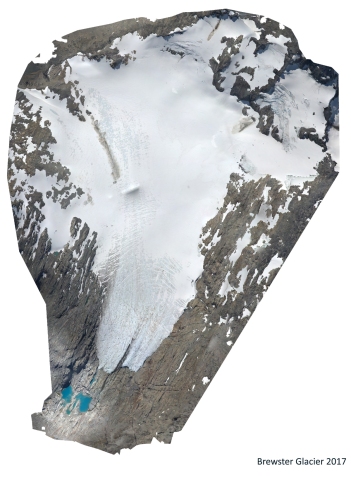
(click, drag or swipe left / right on the following image to compare ice volumes of Brewster Glacier 2016 versus 2017)
Comparing the end of summer snowline images of Brewster Glacier in 2016 vs 2017. 50 New Zealand glaciers like the Brewster have been photographed each year since 1977. [Composite image credit: Lauren Vargo (@VargoLauren), Victoria University.]
Analysis of the photographs provides absolute numbers on how the snowline has changed which act as the benchmark for evaluating computer models of the glaciers. “It is a tremendous resource that gives us quantitative digital information on how glaciers have changed. It also allows us to reconstruct length changes for glaciers that have never been measured on the ground. ”
For the first time this year a thermal imaging camera will be used that Dr Lorrey hopes will reveal more about the debris-covered ice.
“While it is experimental, we hope it may tell us something about the thickness and extent of the debris cover and the properties of the ice underneath it.”
The scientists begin this year’s aerial snowline survey on Saturday.
