A weekly update describing soil moisture across the country to help assess whether severely to extremely dry conditions are occurring or imminent. Regions experiencing these soil moisture deficits are deemed “hotspots”. Persistent hotspot regions have the potential to develop into drought.
Across the northern North Island, soil moisture levels have generally remained the same or increased slightly when compared to this time last week. Across the central and southern North Island, soil moisture levels have largely remained the same or decreased compared to this time a week ago. Notable increases occurred in northern Northland and the Coromandel Peninsula while the most substantial decreases were observed in southern Hawke’s Bay to south central Waikato.
Across the South Island, moisture levels have mainly increased in the south and west while they have decreased in the east and north. The most dramatic increases were found in parts of Fiordland and a small pocket near the southern Southland and Otago border. The most substantial decreases were found in central and northern Canterbury, with the driest soils compared to normal for this time of the year found in northern Hurunui and southern Kaikoura.
Outlook
After a week that featured above normal precipitation across much of the northern North Island, the next seven days look to have drier conditions there. The weekend should be dry across a majority of the North Island, the exception being some isolated showers on Saturday in west coastal Waikato and Auckland bringing less than 5 mm of rain. Monday also looks generally dry across the extent of the North Island. On Tuesday, a few showers may affect Wellington-Wairarapa, Manawatu-Whanganui, and Taranaki out ahead of a push of southerlies; rainfall will most likely be 10 mm or less. Scattered shower activity will fizzle as it moves northward Tuesday night and Wednesday, with isolated falls of less than 5 mm across the remainder of the central North Island. In the late week period, a storm from the south and west may cause a period of rain for a large part of the North Island; however, falls are most likely to be light or moderate. The east coast may continue to be the driest area on the North Island over the next week with weekly falls most likely less than 10 mm. Weekly rainfall of greater than 10 mm may very well be the exception, not the rule, across the extent of the North Island.
Rain on Friday across Fiordland will continue and expand along the West Coast over the weekend. Falls through Sunday will exceed 50 mm across much of Fiordland with maximum amounts in excess of 125 mm across the north. Along the southern West Coast, rainfall of 50 mm will be common though amounts will decrease considerably just to the north. Spotty showers totalling mostly less than 5 mm will be across the far south over the weekend with dry conditions across the remainder of the South Island. Low pressure may cause a round of rain for Southland and Otago on Monday whilst renewing a moisture surge to Fiordland and the West Coast. A surge of southerlies behind that system may be associated with shower activity for the south, west and east coast on Tuesday. Another, more impressive southerly push later Wednesday into Thursday may cause moderate to heavy rainfall for Fiordland and the West Coast with lighter amounts for the rest of Southland and Otago. Snow may accompany this system on the peaks above 1500 m. A period of steady rain may also occur across Tasman, Nelson, and parts of Marlborough as this system passes. A trend toward drier weather is possible toward the end of the week across the South Island.
Soil Moisture
For the North Island, hotspot areas remain present in southern Hawke’s Bay, much of Wellington-Wairarapa, and northeast coastal Gisborne. Hotspot activity has also expanded across much of Manawatu-Whanganui, southeastern Taranaki, western Hawke’s Bay, and interior southern Waikato. Narrow hotspots in western Waikato and southwestern Northland have been eliminated. A lack of organised rainfall across the North Island may promote hotspot expansion and development over the next week, especially in the central and southern part of the island where soils are already drier than normal for this time of the year.
On the South Island, hotspot areas have generally been eliminated across central Southland. A small hotspot area remains in far north coastal Otago with patchy hotspot areas across eastern Canterbury. The most significant hotspots on the South Island are now across central Canterbury and coastal Hurunui in northeast Canterbury. Hotspot areas across the eastern South Island, particularly in Canterbury, may remain the same or expand over the next week. Some new hotspot development is possible across the northern South Island, especially to the east. Periods of rain across the far south and West Coast through the week will prevent hotspot development there.
NB: due to the timing and reporting of daily 24 hour rainfall amounts (9 am each day) and time required to compute soil moisture deficit values, the rain that occurred on Friday 03 March will not be fully reflected in the soil moisture anomaly maps until Saturday 04 March.
Background
Hotspot Watch a weekly advisory service for New Zealand media. It provides soil moisture and precipitation measurements around the country to help assess whether extremely dry conditions are imminent.
Soil moisture deficit
Soil moisture deficit is the amount of water needed to bring the soil moisture content back to field capacity, which is the maximum amount of water the soil can hold.
Soil moisture anomaly
This is the difference between the historical normal soil moisture deficit (or surplus) for a given time of year and actual soil moisture deficits.
Definitions
“Extremely” and “severely” dry soils are based on a combination of the current soil moisture status and the difference from normal soil moisture (see soil moisture maps at https://www.niwa.co.nz/climate/nz-drought-monitor/droughtindicatormaps).
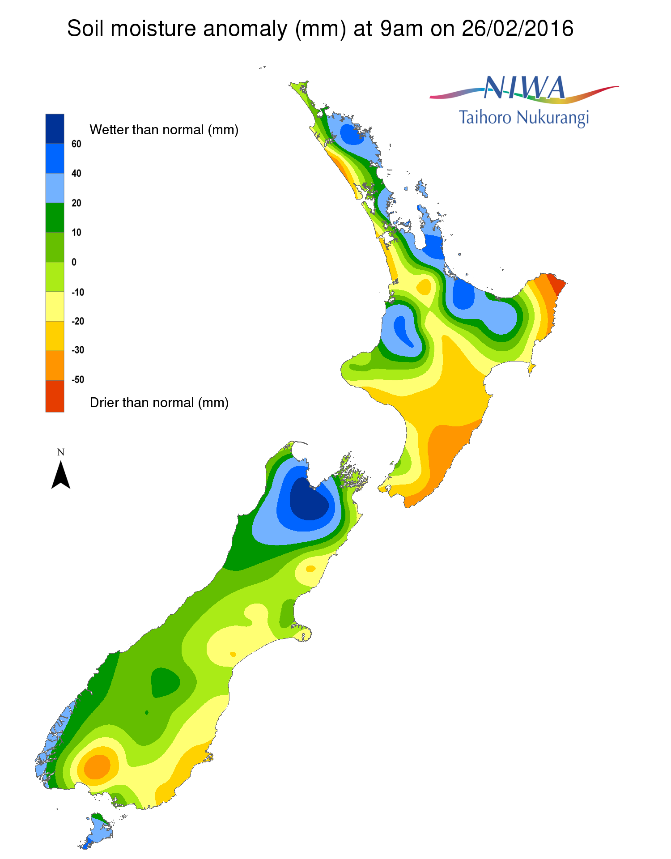
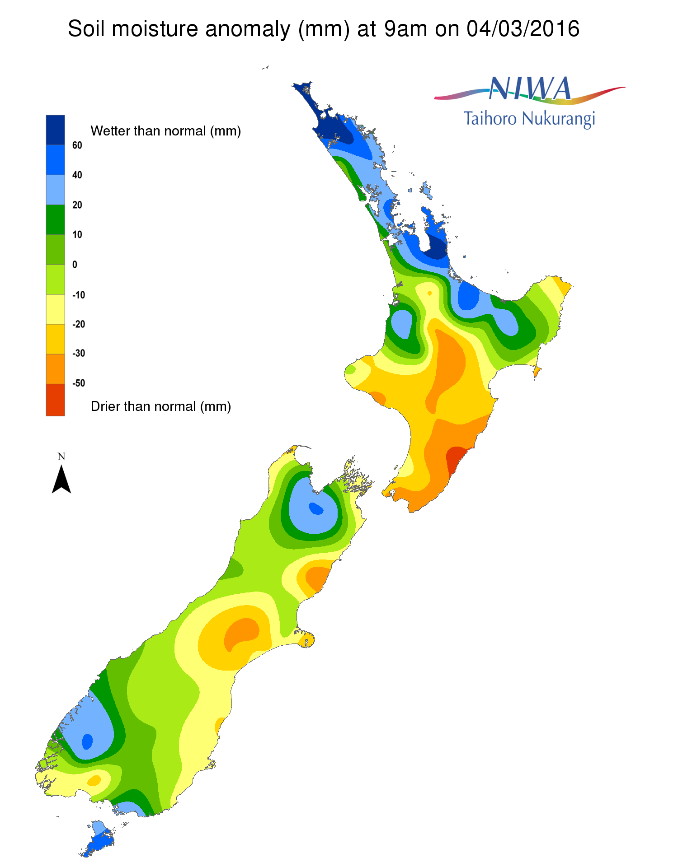
Soil moisture anomaly maps
Pictured below are soil Moisture Anomaly Maps, relative to this time of year. The maps show soil moisture anomaly for the past two weeks.