A weekly update describing soil moisture patterns across the country to show where dry to extremely dry conditions are occurring or imminent. Regions experiencing significant soil moisture deficits are deemed “hotspots”. Persistent hotspot regions have the potential to develop into drought.
Facts: Soil Moisture
High pressure was commonplace over the North Island during the past week, meaning that rainfall was minimal. In fact, most locations received less than 5 mm of rainfall, with some places receiving none at all. The only exceptions were western Waikato and near Wellington City, where small pockets of 15-25 mm were observed. This resulted in widespread moderate-to-large soil moisture decreases throughout the North Island in the past week. The driest soils across the North Island, when compared to normal for this time of the year, are found in southern Waikato, while the wettest soils for this time of the year for the North Island are found in the Far North.
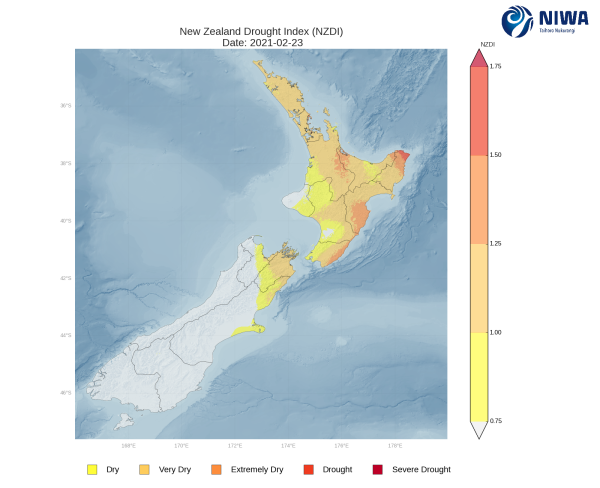
Hotspot conditions remain widespread across the North Island, including southern Northland, southern Auckland, much of Waikato, eastern Bay of Plenty, East Cape, Hawke’s Bay south to Wairarapa, much of Manawatū-Whanganui, and Kapiti Coast. The New Zealand Drought Index (NZDI) map below shows that meteorological drought is in place in a portion of East Cape, while widespread dry-to-extremely dry soils are in place across most of the rest of the North Island.
In the South Island, pockets of moderate rainfall (generally up to 75 mm) were observed in the lower West Coast, Fiordland, and western Tasman. 25 mm or more was also observed in the Nelson area. However, rainfall amounts were meagre in the eastern South Island, with most locations receiving less than 5 mm, and some receiving none at all. This resulted in small-to-moderate soil moisture decreases for most locations, although soil moisture increases were observed in Fiordland. The driest soils in the South Island compared to normal for this time of year are located in western Tasman, eastern Southland, and Clutha District, while the wettest soils for this time of the year for the South Island are found in Fiordland.
Hotspots are currently in place in Nelson and nearby parts of Tasman and Marlborough, coastal Hurunui, Banks Peninsula, Selwyn District, and Clutha District. The New Zealand Drought Index (NZDI) map below shows that dry to very dry soils are widespread in the northeastern South Island.
Outlook and Soil Moisture
Through Monday (1 March), generally tranquil weather is expected across the North Island. However, these days may feature isolated showers that produce light rainfall in localised areas. An arriving front will bring more numerous showers and perhaps thunderstorms to the western and central North Island on Tuesday. By late next week, a moisture-rich front may reach the upper North Island, bringing the chance for locally heavy rainfall. Weekly rainfall totals could reach 20-40 mm in the upper and western North Island, while the east coast is likely to see amounts of 20 mm or less.
Due to the expected weekly rainfall, at least small soil moisture increases will be possible in the upper and western North Island. However, further soil moisture decreases will be possible along the east coast. While current hotspots in much of the North Island may weaken at least slightly, those in the east coast may strengthen and expand.
The South Island may see scattered afternoon showers and thunderstorms this weekend, but rainfall will be very localised. The West Coast may see more substantial rainfall on Monday and Tuesday (1-2 March), but little rain will reach the eastern South Island. By Friday (5 March), another round of moderate rain may affect southern and western areas. Weekly rainfall totals could reach 75-100 mm in the western South Island, with 30-50 mm possible around Nelson. However, far less rainfall is expected in the eastern South Island, where weekly totals could be below 15 mm.
While soil moisture increases will be possible in the western South Island and near Nelson during the next week, further soil moisture decreases are expected in eastern areas. This will likely result in strengthening and expansion of current hotspots in the eastern South Island, while those near Nelson may weaken.
Background:
Hotspot Watch: a weekly advisory service for New Zealand media. It provides soil moisture and precipitation measurements around the country to help assess whether extremely dry conditions are imminent.
Soil moisture deficit: the amount of water needed to bring the soil moisture content back to field capacity, which is the maximum amount of water the soil can hold.
Soil moisture anomaly: the difference between the historical normal soil moisture deficit (or surplus) for a given time of year and actual soil moisture deficits.
Definitions: “Extremely” and “severely” dry soils are based on a combination of the current soil moisture status and the difference from normal soil moisture (see soil moisture maps).
Hotspot: A hotspot is declared if soils are "severely drier than normal" which occurs when Soil Moisture Deficit (SMD) is less than -110 mm AND the Soil Moisture Anomaly is less than -20 mm.
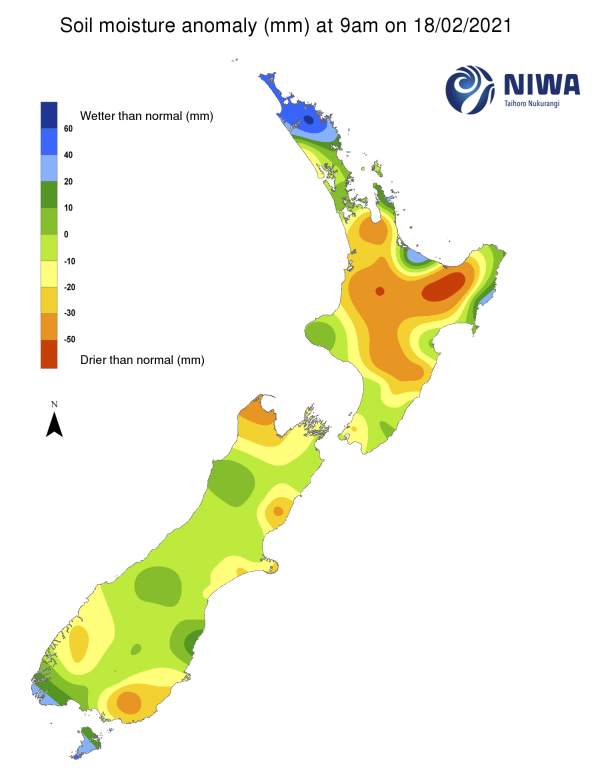
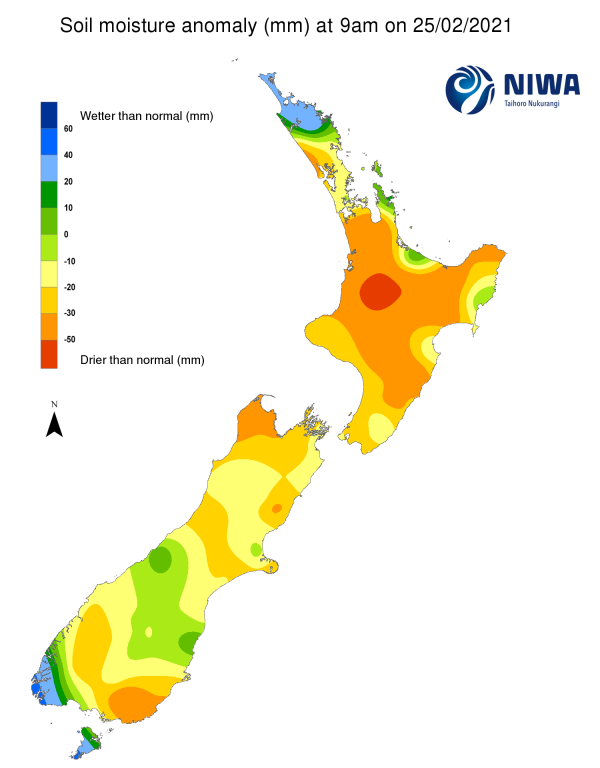
Pictured above: Soil Moisture Anomaly Maps, relative to this time of year. The maps show soil moisture anomaly for the past two weeks.
New Zealand Drought Index (NZDI)
As of 23 February, the New Zealand Drought Index (NZDI) map below shows that meteorological drought is in place in a portion of East Cape. Widespread dry-to-extremely dry soils are in place across most of the North Island and the northeastern South Island. Please note: some hotspots in the text above may not correspond with the NZDI map. This difference exists because the NZDI uses additional dryness indices, including one which integrates the rainfall deficit over the past 60 days. Changes are therefore slower to appear in the NZDI compared to soil moisture anomaly maps that are instantaneously updated.