A weekly update describing soil moisture patterns across the country to show where dry to extremely dry conditions are occurring or imminent. Regions experiencing significant soil moisture deficits are deemed “hotspots”. Persistent hotspot regions have the potential to develop into drought.
Facts: Soil Moisture
Cyclone Gabrielle brought severe to catastrophic flooding to parts of the upper and eastern North Island earlier this week, including portions of Northland, the Coromandel Peninsula, Gisborne, and Hawke’s Bay. Many of these areas received 1-3 times their normal monthly rainfall in less than 48 hours. Much of the North Island outside of the flood zones still received 100 mm or more in the past week, although western areas, such as Taranaki, received 30 mm or less. This resulted in additional soil moisture increases across nearly all of the North Island, although many areas already had well above normal soil moisture or even saturated soils prior to Gabrielle. The driest soils across the North Island, when compared to normal for this time of the year, are found along the Kapiti Coast, while the wettest soils for this time of the year are found across a majority of the island.
No hotspots are currently located in the North Island.
In the South Island, significant rainfall associated with Gabrielle affected far northern Canterbury, where amounts of more than 100 mm were observed. 75-100 mm occurred in Banks Peninsula, with 25-50 mm in central Canterbury. However, the remainder of the South Island saw little if any rainfall in the past week. This resulted in moderate soil moisture increases in northern Canterbury and Banks Peninsula, but notable decreases were observed across the remainder of the island. The driest soils in the South Island, when compared to normal for this time of the year, are located in northern Buller District, while the wettest soils for this time of the year are found in eastern Marlborough and northern Tasman.
South Island hotspots are currently located in nearly all of southern Canterbury, Otago, and eastern and interior Southland. As of 14 February, the New Zealand Drought Index (NZDI) map below shows that dry to extremely dry conditions are currently located in large portions of the northwestern and lower South Island, along with Banks Peninsula and Stewart Island. In addition, a small portion of southeastern Otago has entered meteorological drought.
Outlook and Soil Moisture
In the North Island, pockets of heavy showers and thunderstorms will affect the Central Plateau and east coast this afternoon (16 February). Thereafter, high pressure is expected to bring several days of mostly to entirely dry weather into the middle of next week. Weekly rainfall totals of 30-50 mm may occur in the lower North Island, with 15-30 mm in localised parts of the Central Plateau and east coast. However, amounts of less than 10 mm are expected in the upper and western North Island.
Due to the expected rainfall in the next week, slight soil moisture decreases may occur in the upper and western North Island, with little change expected elsewhere.
In the South Island, mostly dry weather will occur through Sunday (19 February), with only isolated showers in interior areas. However, early next week a plume of moisture may affect the lower South Island and West Coast on Tuesday and Wednesday (21-22 February). This could result in moderate to heavy rain occurring in the West Coast, Otago, and Southland. Weekly rainfall totals could reach or exceed 100 mm in the central and lower West Coast, with 25-50 mm possible in the lower South Island. However, lighter amounts of 25 mm or less are likely across the remainder of the island.
Due to the expected rainfall in the next week, soil moisture levels could increase in much of the West Coast, along with at least small improvements in the lower South Island. However, much of the upper and eastern South Island could see small soil moisture decreases. Current hotspots in the lower South Island may weaken slightly in the next week, but hotspots may expand farther north into Central Canterbury. In addition, a new hotspot may form near Nelson.
For more information on the potential for dryness in the weeks to come, please check out the drought forecasting tool, a collaboration between NIWA and the Ministry for Primary Industries.
https://shiny.niwa.co.nz/drought-forecast/
Background:
Hotspot Watch: a weekly advisory service for New Zealand media. It provides soil moisture and precipitation measurements around the country to help assess whether extremely dry conditions are imminent.
Soil moisture deficit: the amount of water needed to bring the soil moisture content back to field capacity, which is the maximum amount of water the soil can hold.
Soil moisture anomaly: the difference between the historical normal soil moisture deficit (or surplus) for a given time of year and actual soil moisture deficits.
Definitions: “Extremely” and “severely” dry soils are based on a combination of the current soil moisture status and the difference from normal soil moisture (see soil moisture maps at https://www.niwa.co.nz/climate/nz-drought-monitor/droughtindicatormaps)
Hotspot: A hotspot is declared if soils are "severely drier than normal" which occurs when Soil Moisture Deficit (SMD) is less than -110 mm AND the Soil Moisture Anomaly is less than -20 mm.
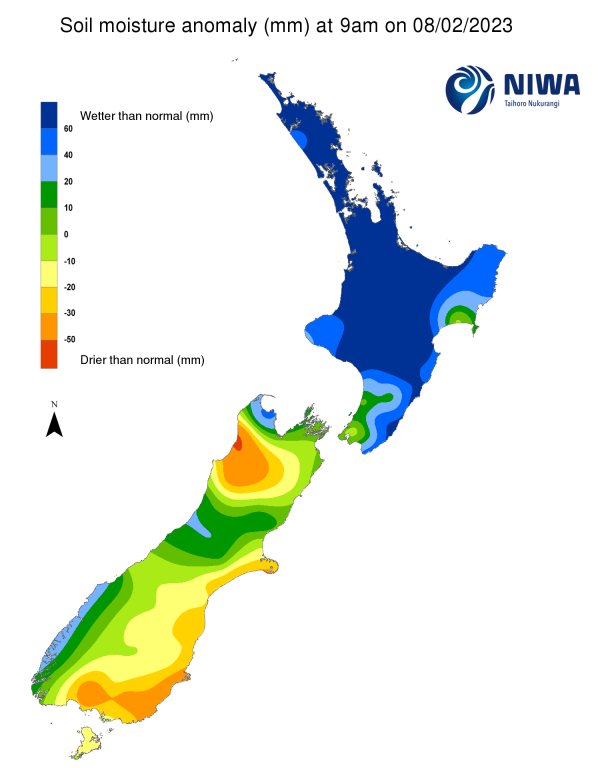
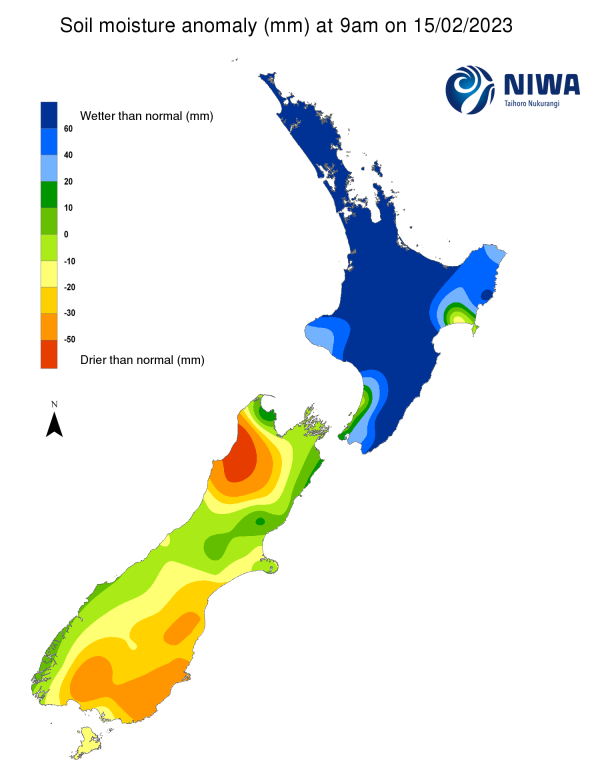
Pictured above: Soil Moisture Anomaly Maps, relative to this time of year. The maps show soil moisture anomalies over the past two weeks.
New Zealand Drought Index (NZDI)
As of 14 February, the New Zealand Drought Index (NZDI) map below shows that dry to extremely dry conditions are currently located in large portions of the northwestern and lower South Island, along with Banks Peninsula and Stewart Island. In addition, a small portion of southeastern Otago has entered meteorological drought. Please note: some hotspots in the text above may not correspond with the NZDI map. This difference exists because the NZDI uses additional dryness indices, including one which integrates the rainfall deficit over the past 60 days. Changes are therefore slower to appear in the NZDI compared to soil moisture anomaly maps that are instantaneously updated.