A weekly update describing soil moisture patterns across the country to show where dry to extremely dry conditions are occurring or imminent. Regions experiencing significant soil moisture deficits are deemed “hotspots”. Persistent hotspot regions have the potential to develop into drought.
Facts: Soil Moisture
In the North Island, prevalent high pressure during the past week resulted in meagre rainfall amounts for all locations. Generally, rainfall amounts were 5 mm or less, with large swaths of the central and lower North Island seeing no rainfall at all in the past week. This dryness resulted in generally moderate to large soil moisture decreases across the entire North Island. The driest soils across the North Island, when compared to normal for this time of the year, are found in western Northland, while the wettest soils for this time of the year are found in Kāpiti Coast and Wairarapa.
Due to the last week’s dryness, hotspots have expanded, and are now located across nearly all of Northland and Auckland, and parts of northern Waikato. As of 8 March, the New Zealand Drought Index (NZDI) map below shows that dry or very dry conditions are now located in parts of Northland, Auckland, and northern Waikato.
In the South Island, moderate rainfall amounts of 30-70 mm were observed in Fiordland and the lower West Coast, with up to 30 mm in parts of Southland and Otago. However, rainfall totals in the central and upper South Island were minimal, generally 5 mm or less. This resulted in moderate soil moisture decreases in the upper and central South Island, with little change farther south. The driest soils in the South Island, when compared to normal for this time of the year, are located in coastal Southland and Stewart Island, while the wettest soils for this time of the year are found in northern Canterbury.
South Island hotspots are currently located along the south coast of Otago, much of coastal Southland, and much of Stewart Island. As of 8 March, the New Zealand Drought Index (NZDI) map below shows that dry or very dry conditions are now located in coastal Otago and much of Southland. In addition, extremely dry conditions are located in coastal Southland and much of Stewart Island, with meteorological drought emerging near Tiwai Point and in northern Stewart Island.
Outlook and Soil Moisture
In the North Island, a weak front will reach southern and western regions on Saturday (12 March) and early Sunday, bringing generally light rainfall amounts. By early next week, a slow-moving subtropical low will approach the northeastern North Island, funnelling moderate to heavy rain into Gisborne and Hawke’s Bay through to about Wednesday (16 March) before moving offshore. High pressure is expected to return thereafter. Weekly rainfall totals could exceed 100 mm in Gisborne and Hawke’s Bay, with up to 50 mm in Wairarapa. Elsewhere, however, rainfall totals are expected to be much lower, generally less than 20 mm.
Due to the expected rainfall in the next week, soil moisture levels along the east coast could increase substantially, particularly in Gisborne and Hawke’s Bay. However, further soil moisture decreases are likely to occur in the western and northern North Island. This will likely result in a further strengthening and expansion of the current hotspots located in the upper North Island.
In the South Island, a front moving up the West Coast today (11 March) will deliver moderate rainfall amounts. Beginning on Saturday, high pressure will dominate for several days, leading to mostly if not entirely dry weather. By late Tuesday and Wednesday (15-16 March), a weak front may bring showers to the lower and eastern South Island. Weekly rainfall totals could be as high as 50-75 mm for parts of the West Coast and Tasman, but elsewhere, amounts are likely to be less than 20 mm.
Due to the expected rainfall in the next week, soil moisture levels will likely decrease across a majority of the South Island, with the exception of the West Coast and Tasman. This will likely cause an expansion of the current hotspots in Southland and Stewart Island, with hotspot conditions possibly emerging in interior Otago as well.
Background:
Hotspot Watch: a weekly advisory service for New Zealand media. It provides soil moisture and precipitation measurements around the country to help assess whether extremely dry conditions are imminent.
Soil moisture deficit: the amount of water needed to bring the soil moisture content back to field capacity, which is the maximum amount of water the soil can hold.
Soil moisture anomaly: the difference between the historical normal soil moisture deficit (or surplus) for a given time of year and actual soil moisture deficits.
Definitions: “Extremely” and “severely” dry soils are based on a combination of the current soil moisture status and the difference from normal soil moisture (see soil moisture maps at https://www.niwa.co.nz/climate/nz-drought-monitor/droughtindicatormaps)
Hotspot: A hotspot is declared if soils are "severely drier than normal" which occurs when Soil Moisture Deficit (SMD) is less than -110 mm AND the Soil Moisture Anomaly is less than -20 mm.
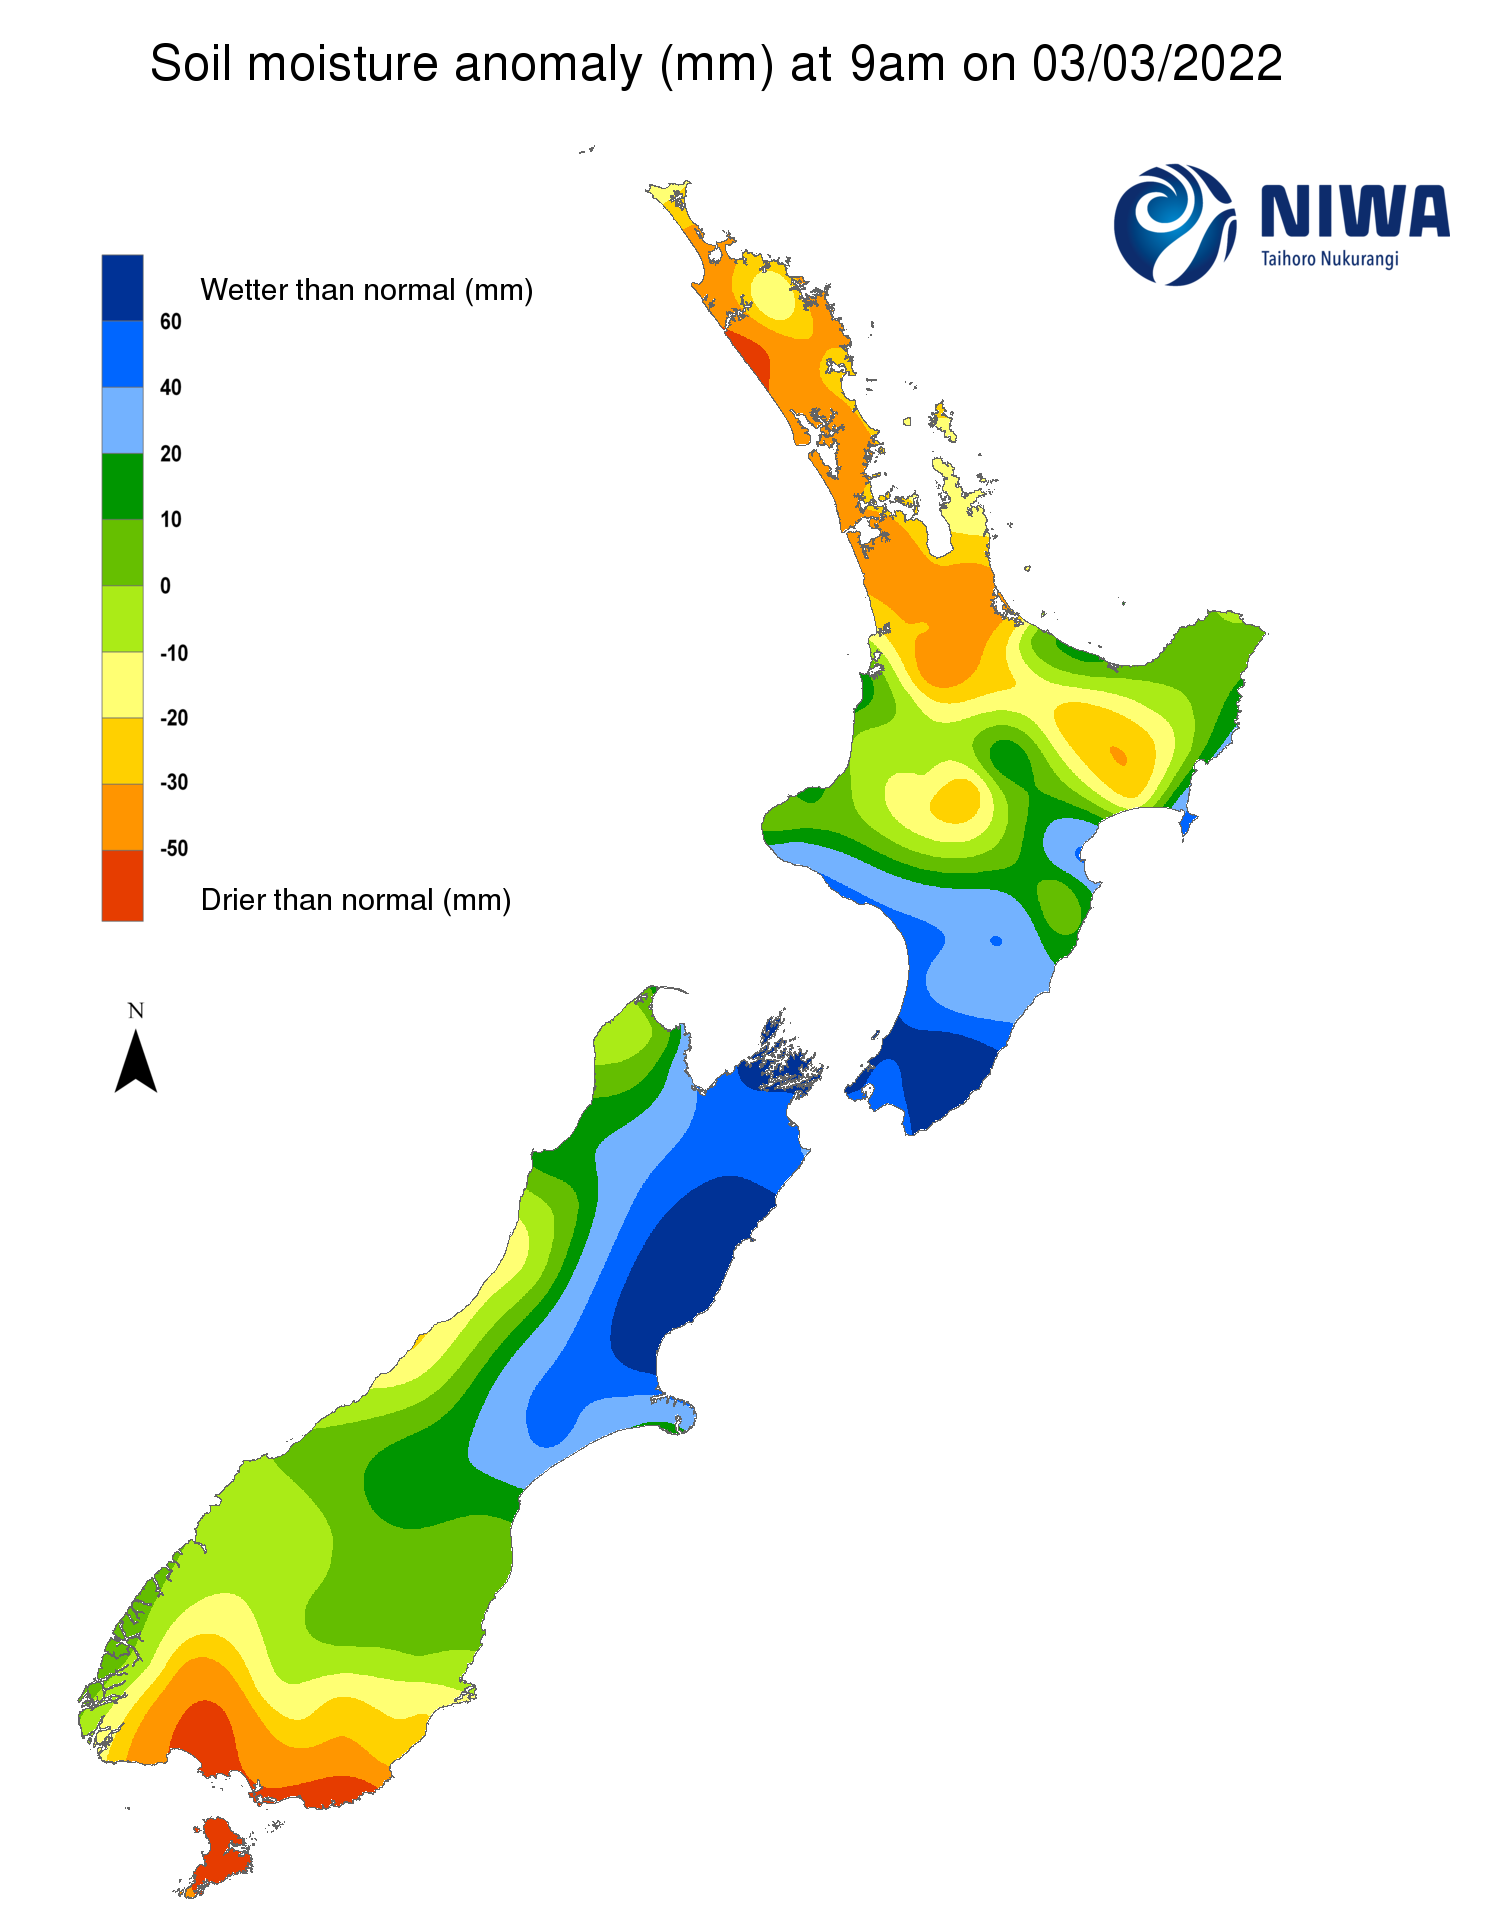
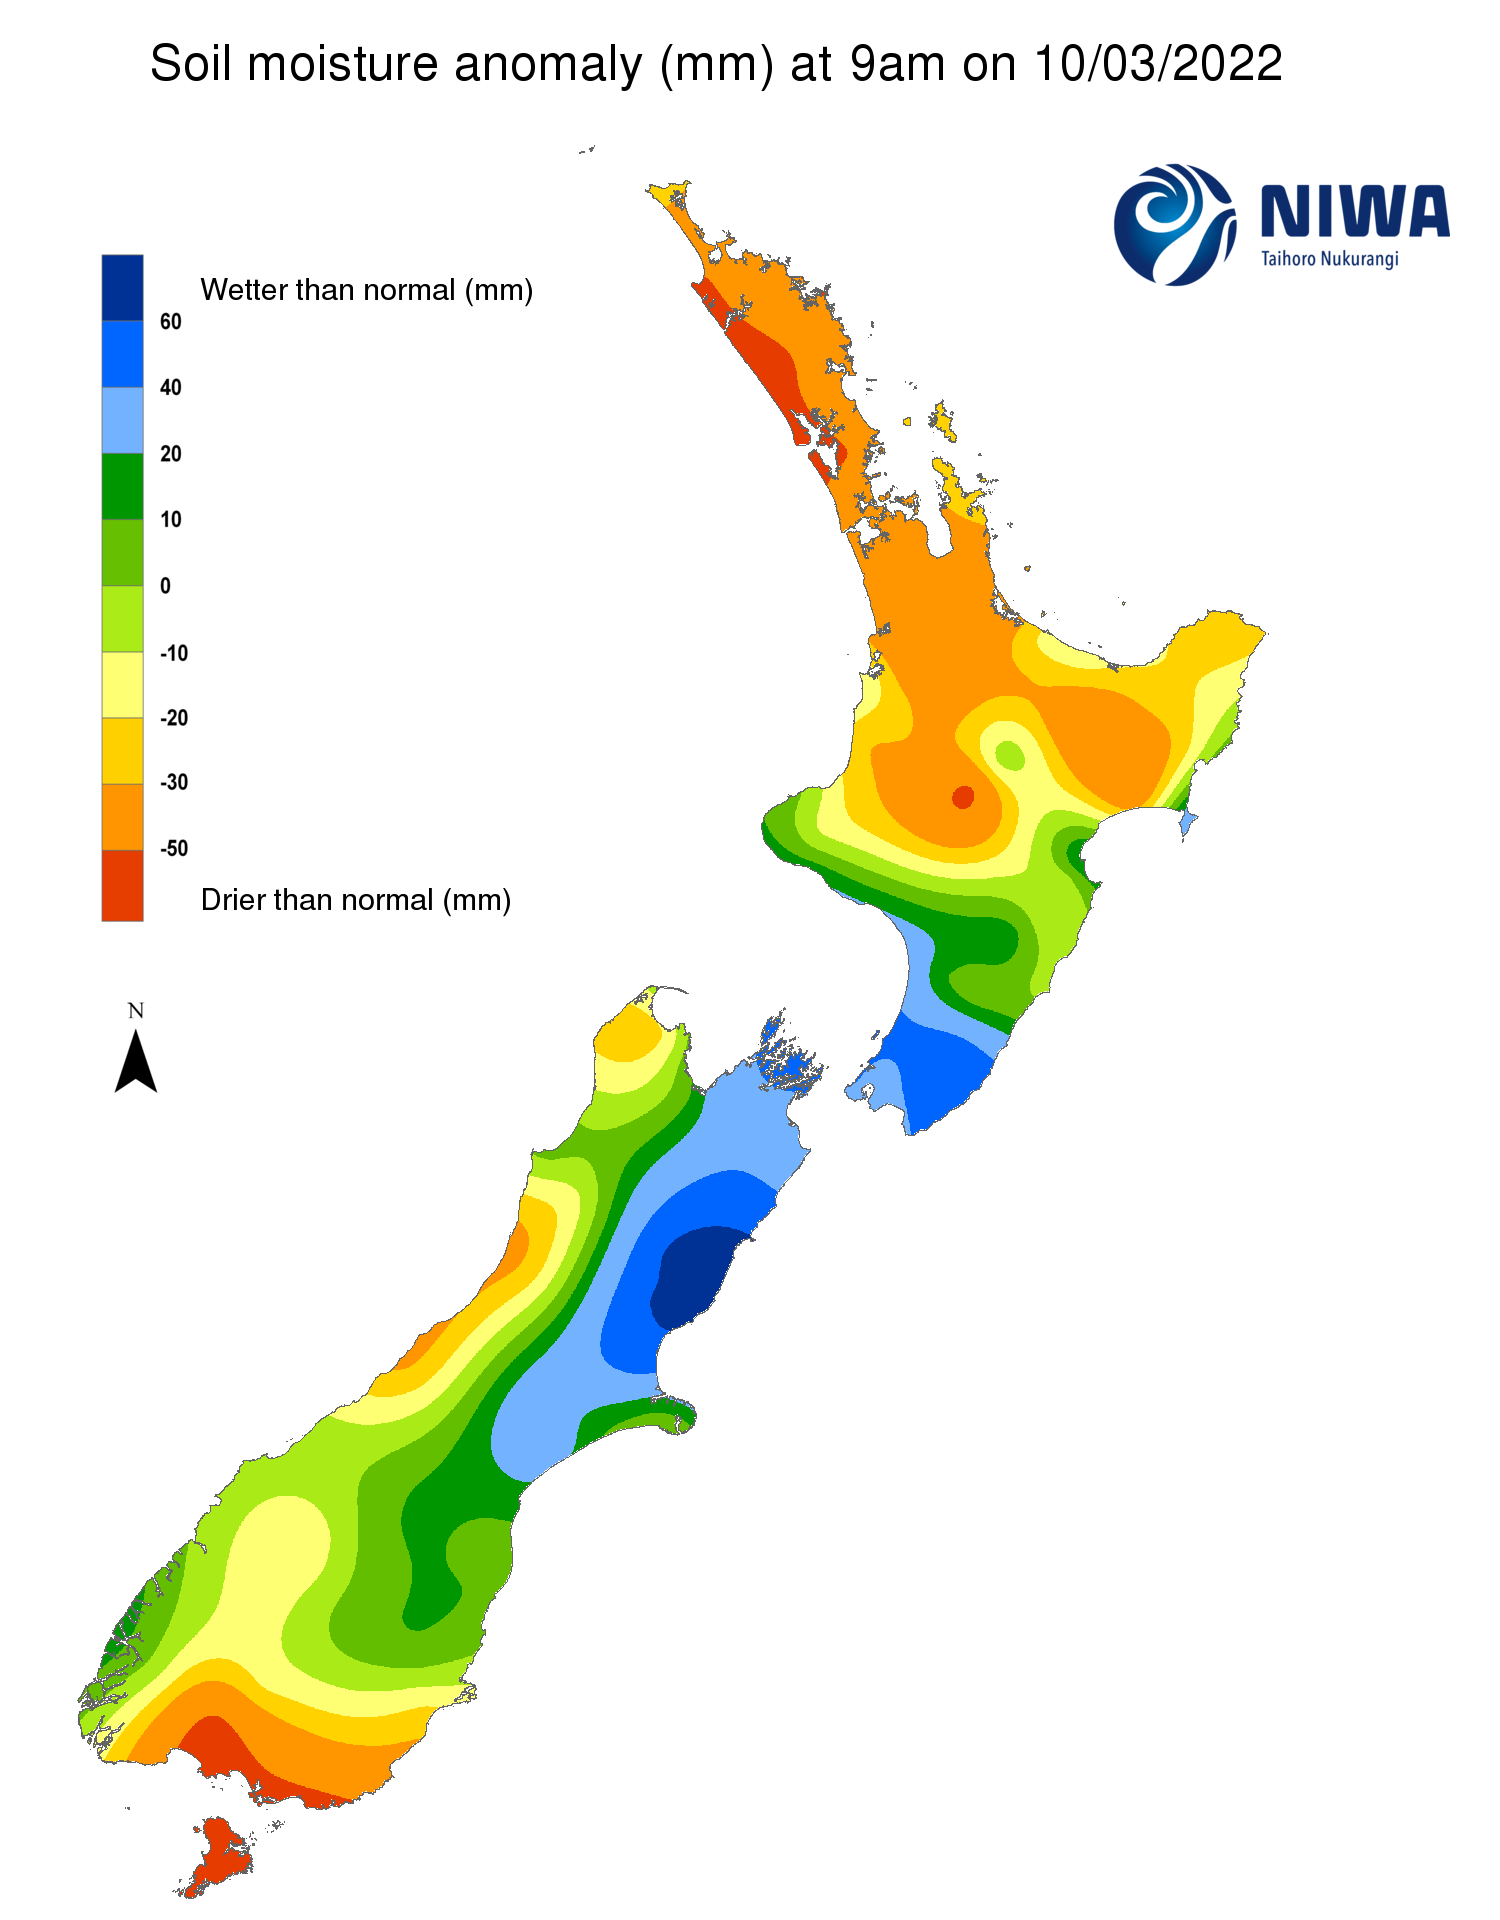
Pictured above: Soil Moisture Anomaly Maps, relative to this time of year. The maps show soil moisture anomaly for the past two weeks.
New Zealand Drought Index (NZDI)
As of 8 March, the New Zealand Drought Index (NZDI) map below shows that dry or very dry conditions are now located in parts of Northland, Auckland, northern Waikato, coastal Otago, and much of Southland. In addition, extremely dry conditions are located in coastal Southland and much of Stewart Island, with meteorological drought emerging near Tiwai Point and in northern Stewart Island.
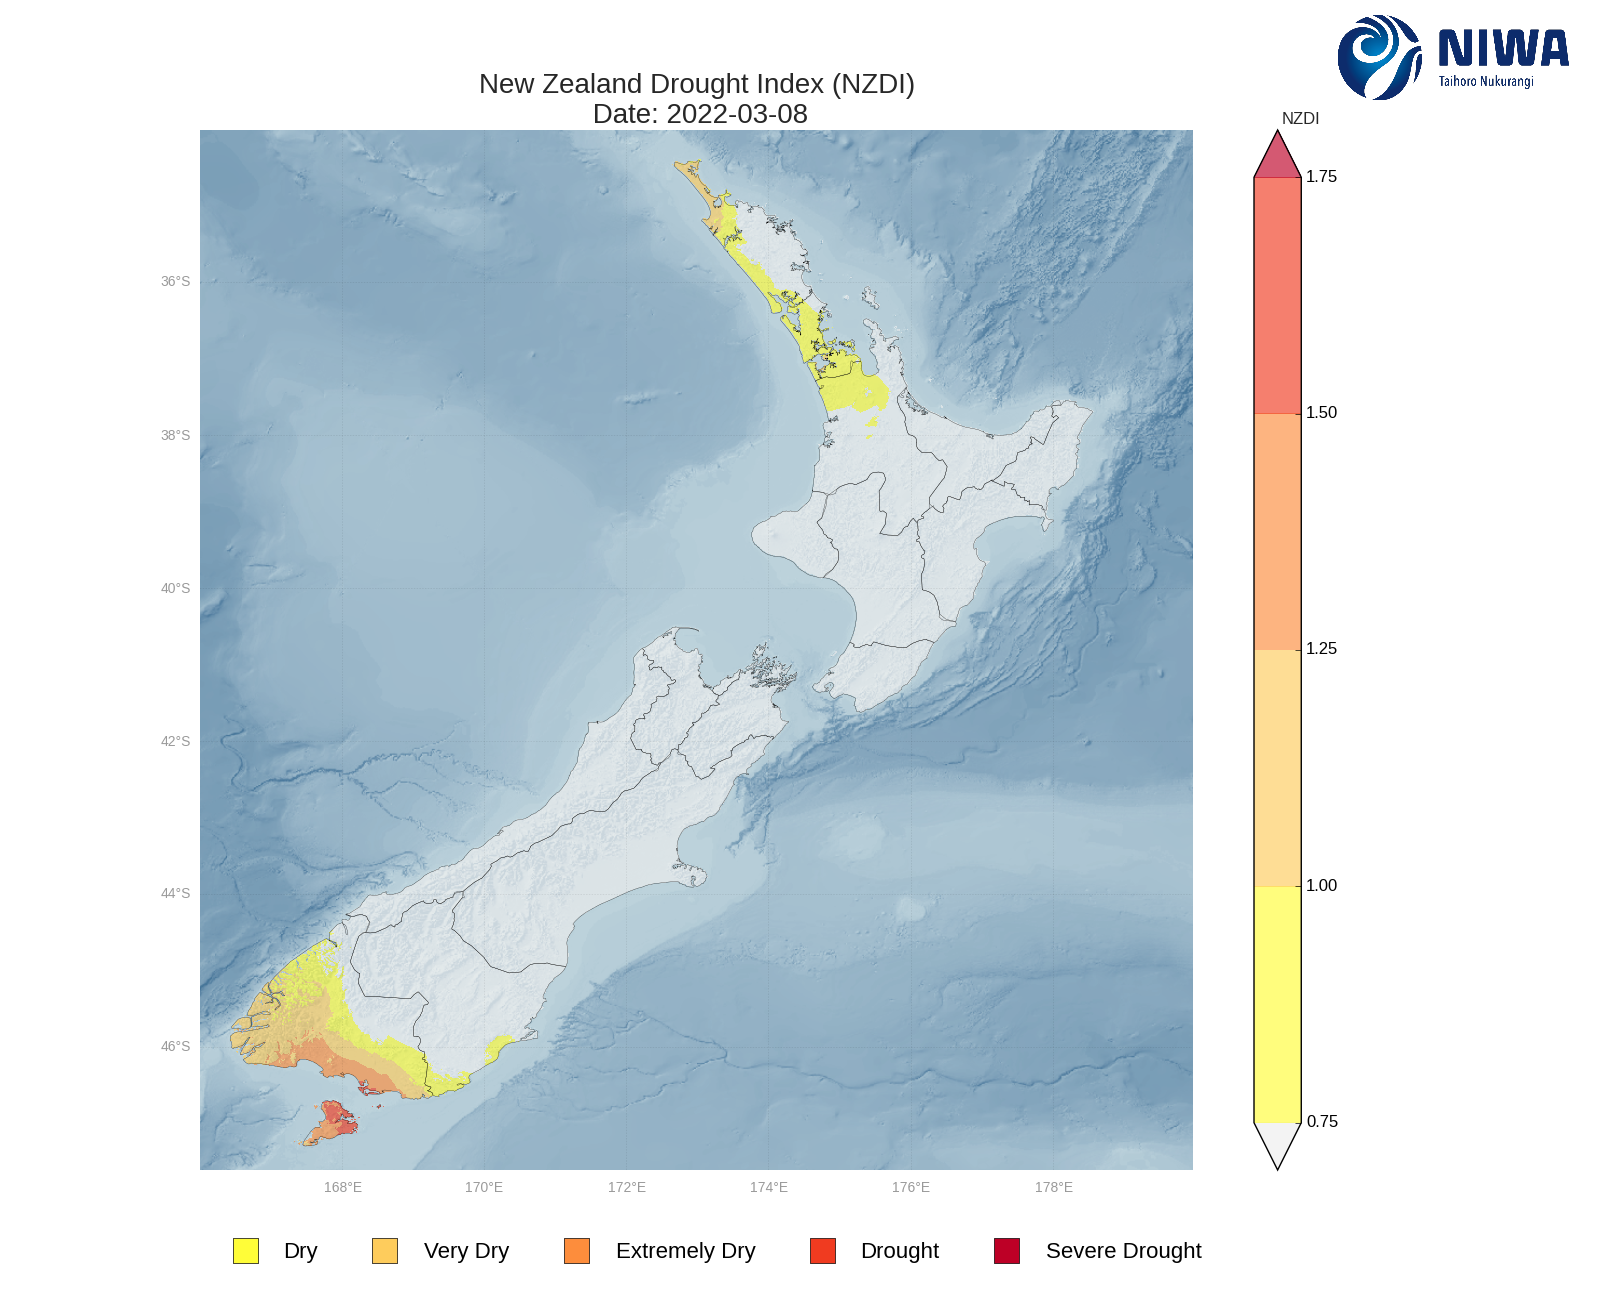
Please note: some hotspots in the text above may not correspond with the NZDI map. This difference exists because the NZDI uses additional dryness indices, including one which integrates the rainfall deficit over the past 60 days. Changes are therefore slower to appear in the NZDI compared to soil moisture anomaly maps that are instantaneously updated.