PDF of this article (1 MB)
Derek Goring Rob Bell
A well-cited consequence of global warming is sea-level rise. What evidence is there that this is happening?

NIWA sea-level recorder network of sites on the open coast, well away from harbours and inlets and the effects of reclamation, siltation and dredging.
On the face of it, our title is fatuous. Sea level is always on the move, as indicated in the adjacent figure and table. But here’s the question that everybody is asking: is it moving more now than it used to?
Giving a definitive answer to this question is not easy and the figure on the right shows why. At Little Kaiteriteri sea level rises and falls twice every day by up to 4 metres (due to the tide); yet to detect sea-level rise we are looking for changes in the order of a millimetre or two from one year to the next. A sea-level record like that shown in the figure contains a spectrum of responses of the ocean to the various physical driving forces listed in the table.
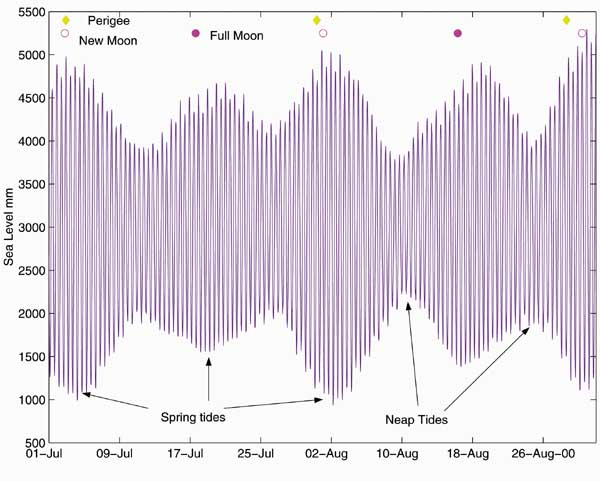
Typical 2-month section of the Little Kaiteriteri sea-level record showing the spring/neap tides and how they are related to the phases of the Moon. The spring tides are larger (called perigean spring tides) when lunar perigee (when the Moon is closest to Earth) coincides with the Full or New Moon.
Fortunately, we can eliminate many of these sea-level responses because they occur at periods that are a lot shorter than one year (i.e., storm surges, tides and seiche). Nevertheless, there remains a lot of variability because of the effects of El Niño–Southern Oscillation (ENSO) at 2- to 5-year cycles and of a recently discovered phenomenon called the Interdecadal Pacific Oscillation (IPO) operating across the Pacific at 20- to 30-year cycles. Unfortunately, these long – but erratic – cycles in sea level mask the underlying trend called sea-level rise that we are all impatient to know about.
Sea-level records are also contaminated by local and regional effects such as plate tectonics, land subsidence, port modifications and sedimentation, oceanic currents, and different regional responses to seasonal and El Niño phenomena. These factors all have the potential to obscure the long-term national rate of sea-level rise, let alone the global rate.
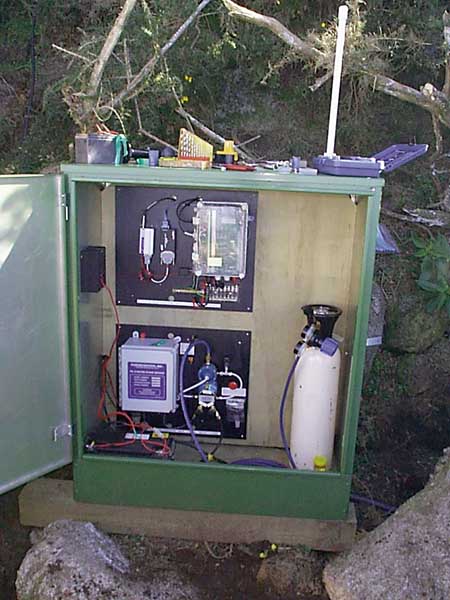
The sea-level recorder station at Little Kaiteriteri.
The short-period effects of tides, storm surges and seiche account for most of the total energy in the record, leaving at most only 2% of the energy contributed by the long-period effects. Hence, to accurately detect these small long-period cycles in sea level, we need high-quality sea-level data. For this reason NIWA has invested in the network of sea-level recorders shown left.
A problem we have with many of the sea-level records collected before 1996 is that the recorders were situated in harbours and ports where reclamations and silting and subsequent dredging affected localised sea levels. We have avoided this by siting our recorders on the open coast, many of them on islands or remote headlands. Another problem with the old records is that the instruments used were simply not accurate enough for us to detect small changes or trends from the record.

The sea-level recorder at Anawhata being serviced by helicopter.
The photograph on the right shows a modern sea-level recording station where all the equipment is electronic and from which digital data are transmitted daily to the base station in Christchurch for quality-checking and archiving. This is an investment for the future, but unfortunately we must still rely on a few long-term port records to get the bigger picture at a timescale of a century.
So, what can we say about whether sea level is rising or not? The graph (below right) shows the annual sea levels at Auckland from 1899 to the present. Overall sea level has risen by 0.14 m per century at Auckland and 0.17 m per century on average across our four main ports. The global average over the 20th Century was a rise of between 0.1 m and 0.2 m per century, with a central value of 0.15 m per century. Longer overseas records from stable ports in Europe indicate that modern sea levels began rising noticeably in the early to mid-1800s, after a 3,000-year period of relatively slow rise of 0.01 to 0.02 m per century.

Annual mean sea level at Port of Auckland since 1899. The overall trend has been 1.4 mm rise per year. The record is subdivided into phases of the 20-30 year cycles of the Interdecadal Pacific Oscillation (IPO), accompanied by a piece-wise fit to sea-level rise. [Data source: Ports of Auckland Ltd, Prof. J. Hannah (University of Otago)]
In the graph, we have divided the Auckland record since 1899 into positive and negative phases of the IPO. Notice that when IPO is in its negative phase, sea level rises faster than when IPO is positive. The Pacific has just come out of a positive phase (from 1976 to 1998), so we can expect sea level to rise faster than it has over the last 20 years. We are already observing increased sea levels at many of our recorders. We predict that sea level will rise more rapidly over the next 20 years or so until the IPO switches back to its positive phase, when sea-level rise will slow again.
The modern network of gauges will provide highly accurate records that will enable us to detect any acceleration in the underlying trend of sea level against the background of ENSO and IPO cycles. The latest sea-level projections by the Intergovernmental Panel on Climate Change (IPCC) indicate a sea-level rise of 0.3 to 0.5 m over this century, around twice that of last century. That means an acceleration in sea-level rise is imminent over the next decade or so because of a warming world driven by the greenhouse effect. However, because of the long-period natural cycles in sea level, confirmation of an acceleration in the trend may take a few decades.
Spectrum of sea-level “drivers” and responses with timescales
| Driver | Sea-level response | Timescale |
|---|---|---|
| Global warming | Long-term sea-level change | Centuries |
| Interdecadal Pacific Oscillation (IPO) | Interdecadal oscillations | Decades |
| El Niño/Southern Oscillation (ENSO) | Interannnual oscillations | Years |
| Annual temperature cycle | Annual cycle | 1 year |
| Changing atmospheric pressure | Inverted barometer | 1 to 7 days |
| Wind | Set-up | 1 to 7 days |
| Gravitational attraction of astronomical bodies | Tides | 24, 12, 8, 6, 3 hour periods |
| Chaotic interactions | Seiche | 2 to 4 hours |
| Submarine earthquakes, avalanches and volcanoes | Tsunami | Minutes to 1 hour |
Further reading
Bell, R.G.; Hume, T.M.; Hicks, D.M. (2001). Planning for climate-change impacts on coastal margins. Report ME410 published by the Ministry for the Environment as part of the NZ Climate Change Programme. (www.climatechange.govt.nz/sp/resources/resources_publications_alt.htm)
Bell, R.G.; Goring, D.G.; de Lange, W.P. (2000). Sea level change and storm surges in the context of climate change. IPENZ Transactions 27(1) Gen:1-10. (www.ipenz.org.nz/ipenz/publications/transactions/)
Douglas, B.C.; Kearney, M.S.; Leatherman, S.P. (2001). Sea level rise – history and consequences. Academic Press, San Diego. 232 p.
Derek Goring is based at NIWA in Christchurch; Rob Bell is at NIWA in Hamilton.