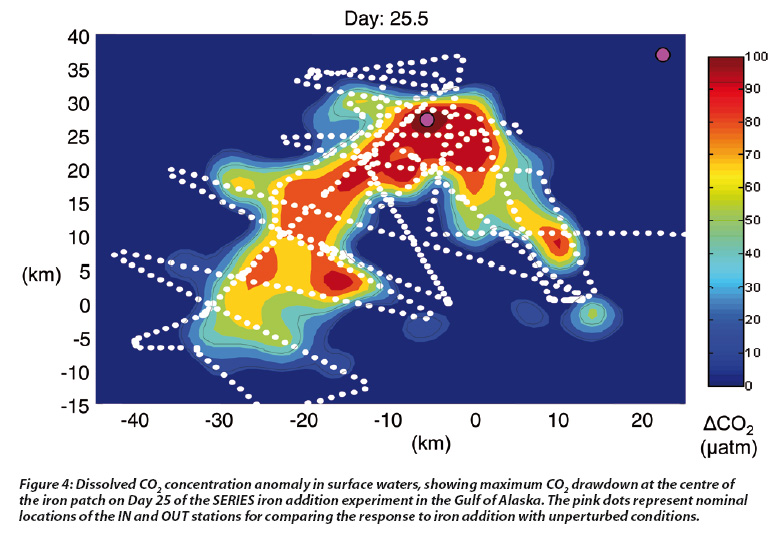
Figure 4: Dissolved CO2 concentration anomaly in surface waters, showing maximum CO2 drawdown at the centre of the iron patch on Day 25 of the SERIES iron addition experiment in the Gulf of Alaska. The pink dots represent nominal locations of the IN and OUT stations for comparing the response to iron addition with unperturbed conditions.