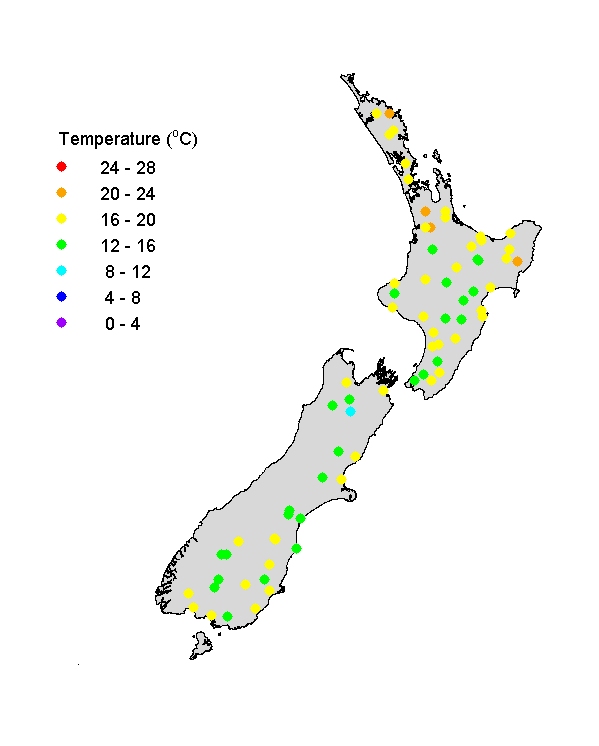
River Temperatures, January to March
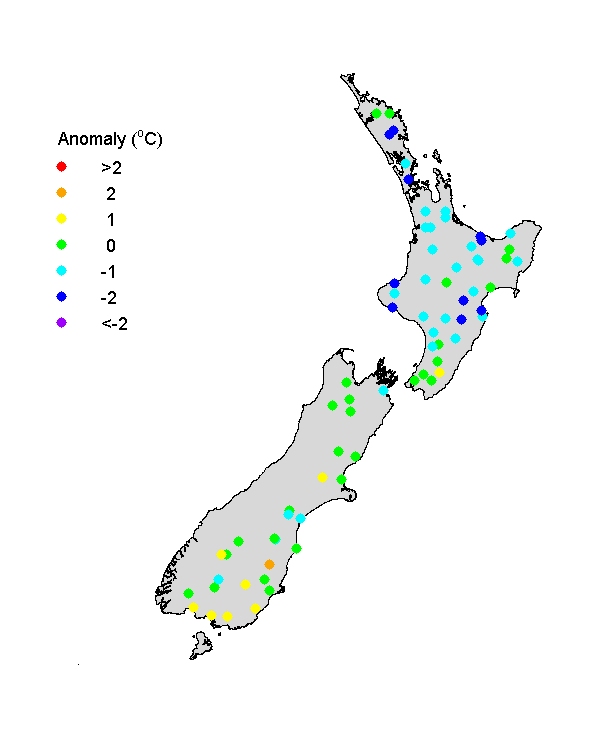
Summer river water temperatures show the typical weak, but distinct, altitudinal and latitudinal (S-N) trends. River water temperatures ranged from about 12 to 24oC and tended to be slightly higher in the north and at lower altitude. The temperature anomaly graph shows that river water temperatures were fairly typical for summer except for being higher than normal in the far south of the South Island and somewhat lower than average over much of the North Island. The negative anomaly in the NI over summer seems broadly consistent with a pattern of unsettled, cool and wet weather
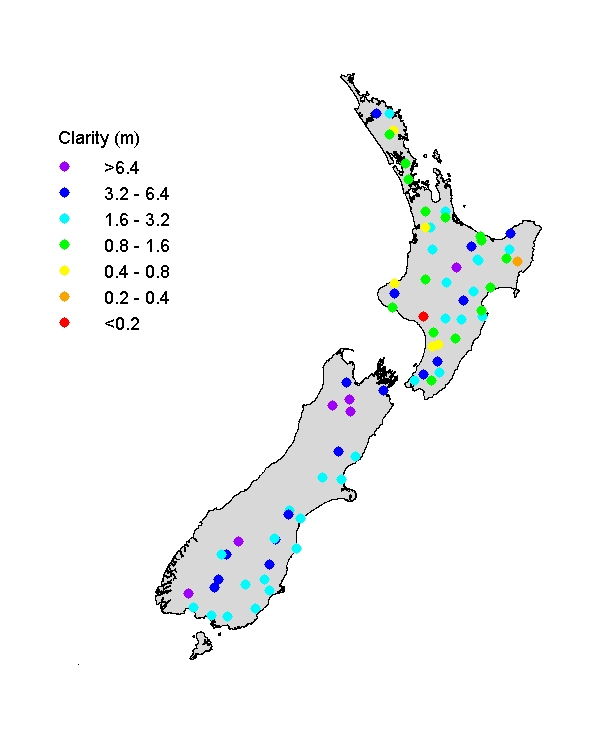
Visual clarity of rivers, January to March
Visual clarity ranged widely, from <0.4m to >6 m, reflecting New Zealand's diversity of soil types and erosion resistance of rocks together with land use. Rivers in catchments with pastoral land use typically yield lower visual clarity than forested catchments. Visual clarity was lower than normal at many river sites in the North Island for summer, consistent with higher than normal flows in a rather wet summer (visual clarity is strongly inversely related to flow state in rivers). Conversely, rivers in the South Island tended to be clearer than normal, because flows, particularly in alpine-fed rivers, were relatively low.