Why do we perform stock assessments?
To get the most benefit from a fish stock in the long term, we need to maximise the catch without damaging the fish population we rely on. Stock assessments allow us to discover how fish populations have been affected in the past, and what the effects of different management decisions (e.g., quotas) are likely to be on future yields.
A useful indicator of stock status is the spawning stock biomass (total mass of breeding-age fish) compared to the initial biomass (B0), as a percentage. The initial biomass is an estimate of the fish population before fishing began, or the population it would return to eventually if fishing was halted.
In New Zealand, fisheries often safely operate within a target range of 30% - 45%, depending upon the species and the stock. However, a biomass level below 20% represents an overfished stock and one below 10% is deemed to be 'collapsed' and is at risk of not recovering, and may even result in an ecosystem shift where other creatures fill the niche the species used to inhabit.
These limits reflect current international best practice and are based upon real experience of fish stocks in other parts of the world. New Zealand's science-based fisheries management means our fisheries are healthy by global standards.
How do we assess fish stocks?
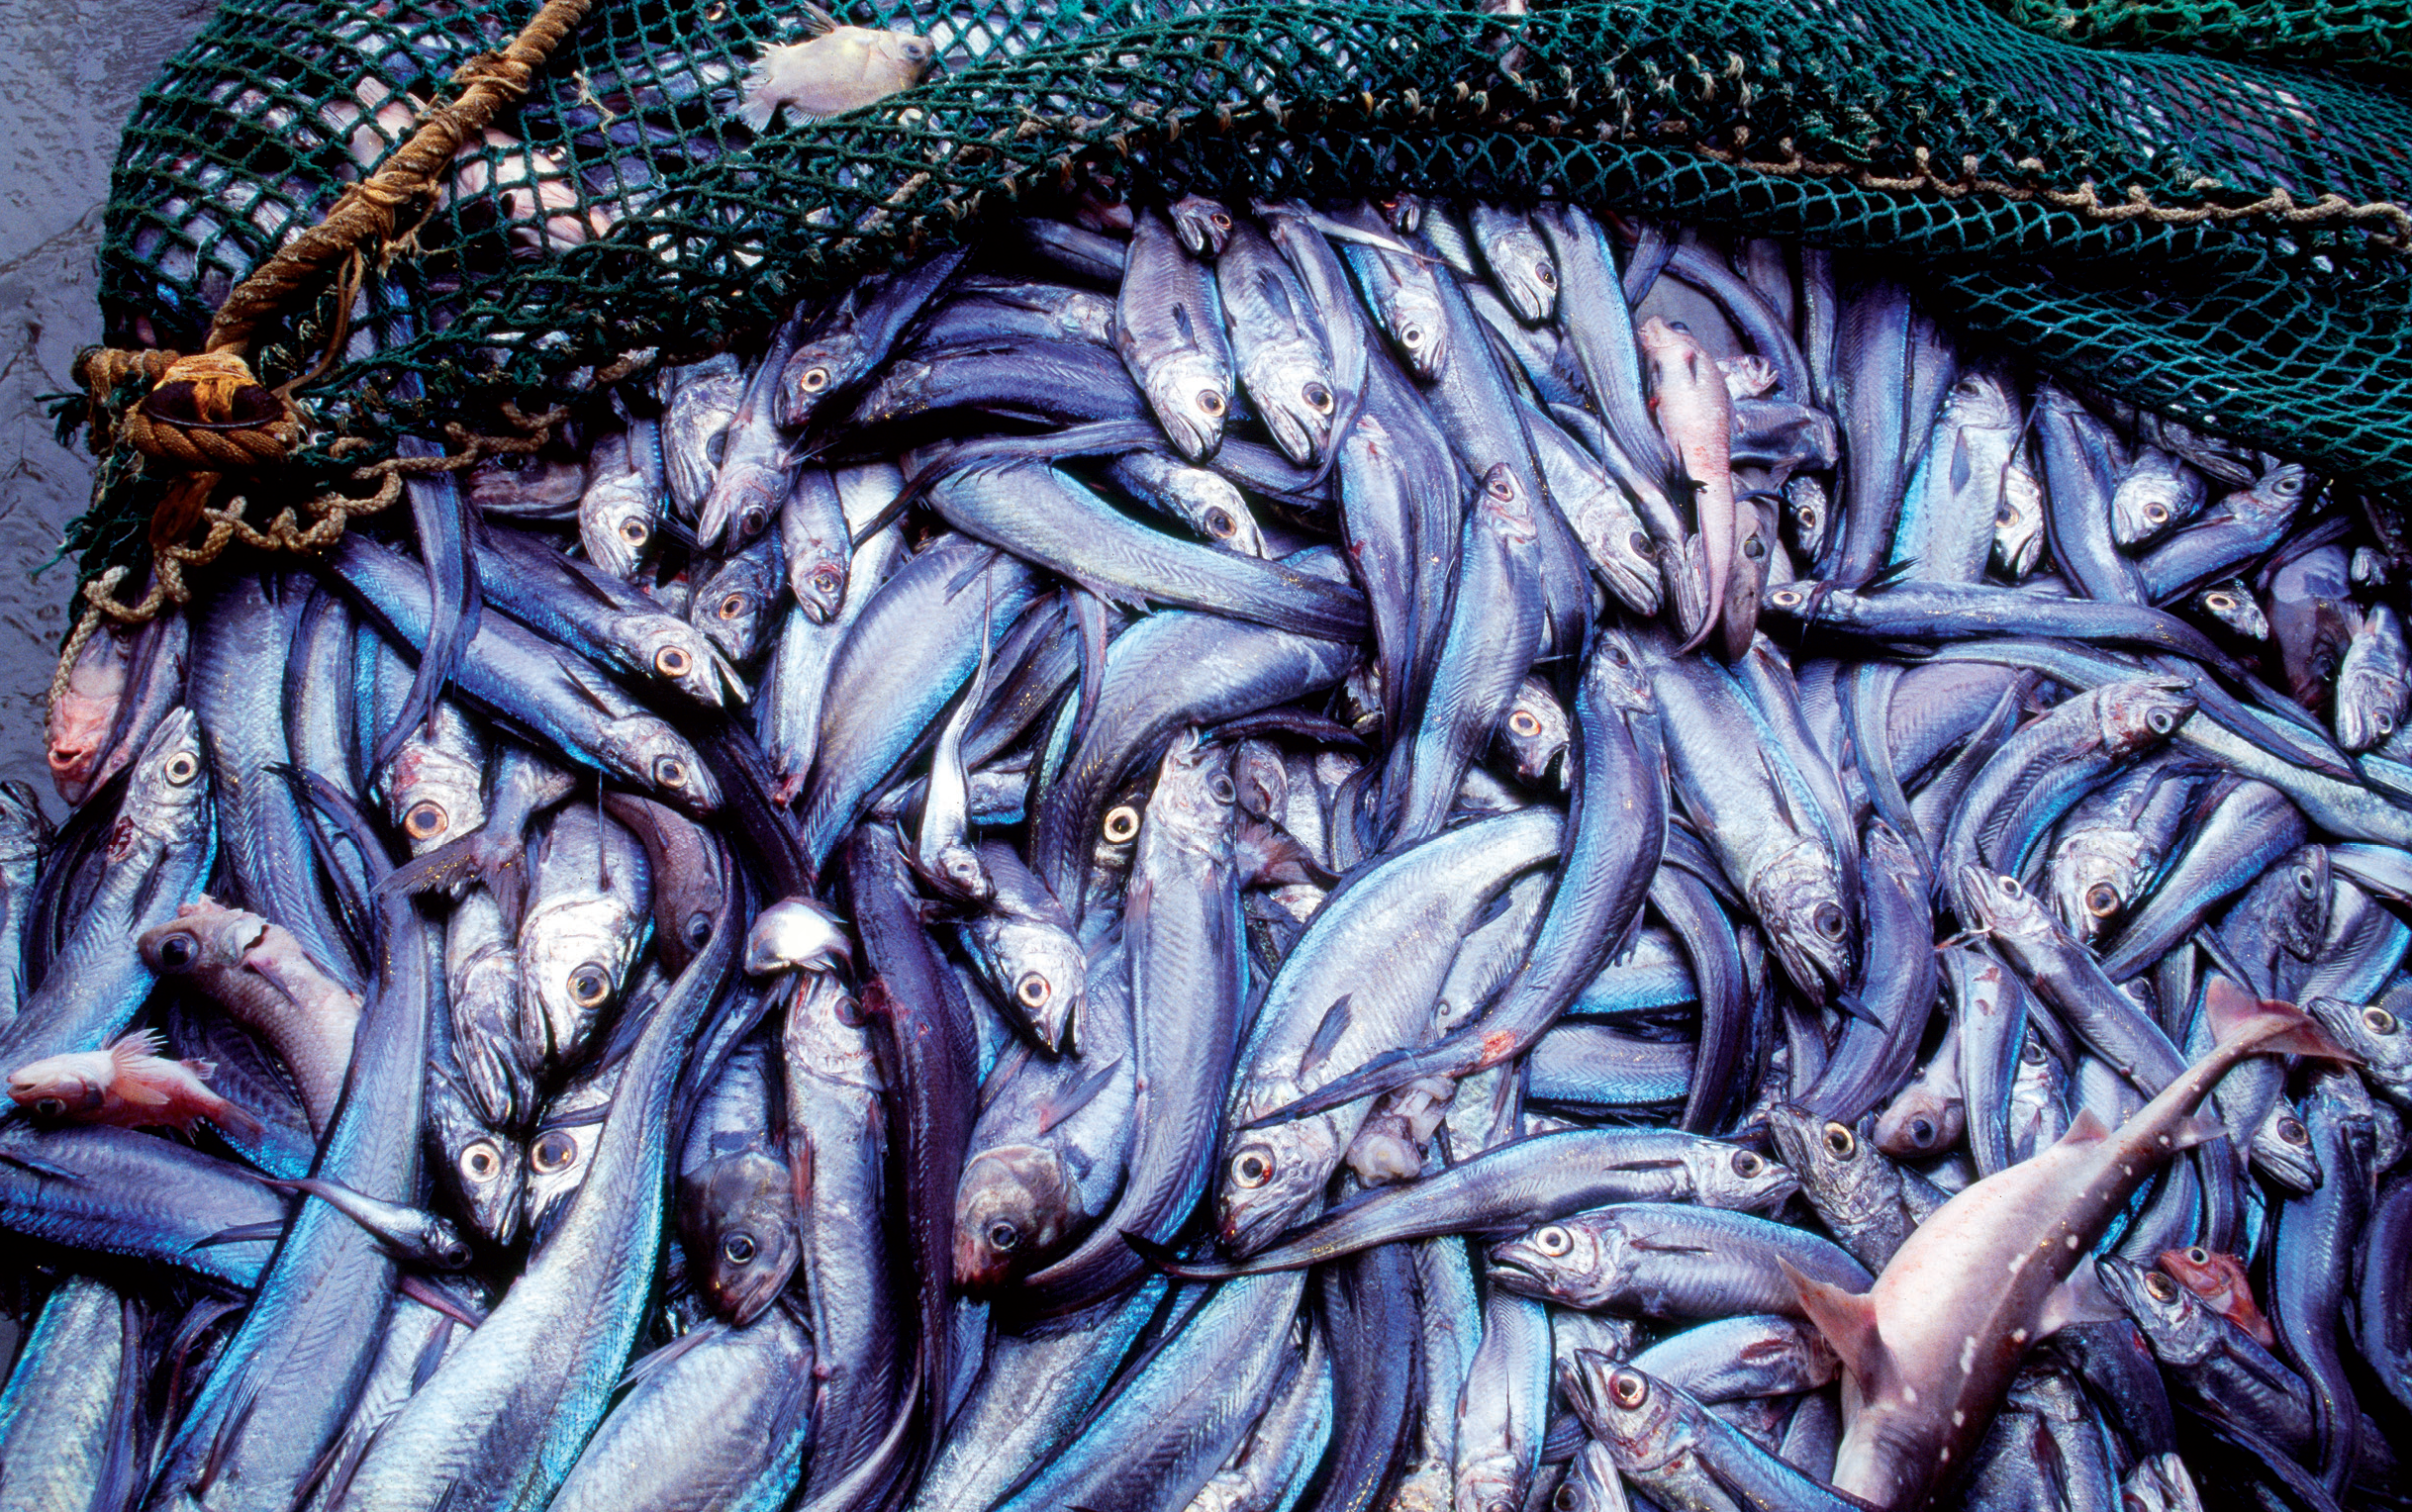
NIWA assesses many of the fish stocks around New Zealand as part of our work for the Ministry for Primary Industries (MPI). This is based on industry, recreational and customary catch, catch and effort data, scientific sample voyages, biological information and sophisticated mathematical models. These help us to understand what has happened, and describe the likely effects on fish stocks of different management decisions.
These stock assessments provide a scientific basis for the management options that are developed and considered by MPI, along with other organisations with an interest in fisheries. MPI is responsible for managing these resources, and considers not only the science from NIWA on sustainability, but also research results and information on the economic, cultural, and recreational consequences of its quotas and other decisions.
What are fisheries assessment models?
A fisheries assessment model is a mathematical description of the population dynamics and processes in a fish population. These models have been developed over many years, and are measured against actual stock performance and environmental indicators.
The models use the biological characteristics of a species, together with catch and other data, to estimate the effects of commercial, recreational, and customary take on the stock. By modelling their productivity, along with scientific and fishery data on the age and size structure of the catch, we can develop an understanding of the reasons behind the changes in abundance measured by surveys and other scientific research.
Why do we use them?
These models provide the best way to integrate the information and data we collect on the status of our fish stocks. These also provide us with estimates of our uncertainty — allowing us to be explicit about how much we know or don't know.
Fisheries models are typically used to model a population from some initial state to the current day, and then predict from that point into the future under assumptions about future catches.
There are a wide variety of fisheries assessment models, ranging from those that model only the total biomass in the population and how it changes, to those that model the age/length structure of the population in spatially explicit areas. Most use highly sophisticated statistical methods to estimate stock size and its age/length composition from the available data.
What do we need to know in order to run an assessment model?
There is a wide range of data that goes into a typical stock assessment. We use data on the age and length structure, including how this has changed over time, along with biomass trends from catch rates and scientific surveys.
The data recorded about our fish and fisheries are an important part of fisheries assessment models. By combining these data into a sophisticated stock model, we can model the growth of individuals in the population, and predict what will happen to them under different scenarios in the future.
One of NIWA's main modelling frameworks is the stock assessment package CASAL. CASAL is an advanced software package developed by NIWA that uses world-leading Bayesian integrated analysis methods to undertake quantitative assessments. Many of New Zealand's fish stocks are assessed using CASAL, including our deepwater (e.g., orange roughy), middle depth (e.g., hoki), inshore (e.g., snapper) and shellfish fisheries.
What are the sorts of data we use?
Catch
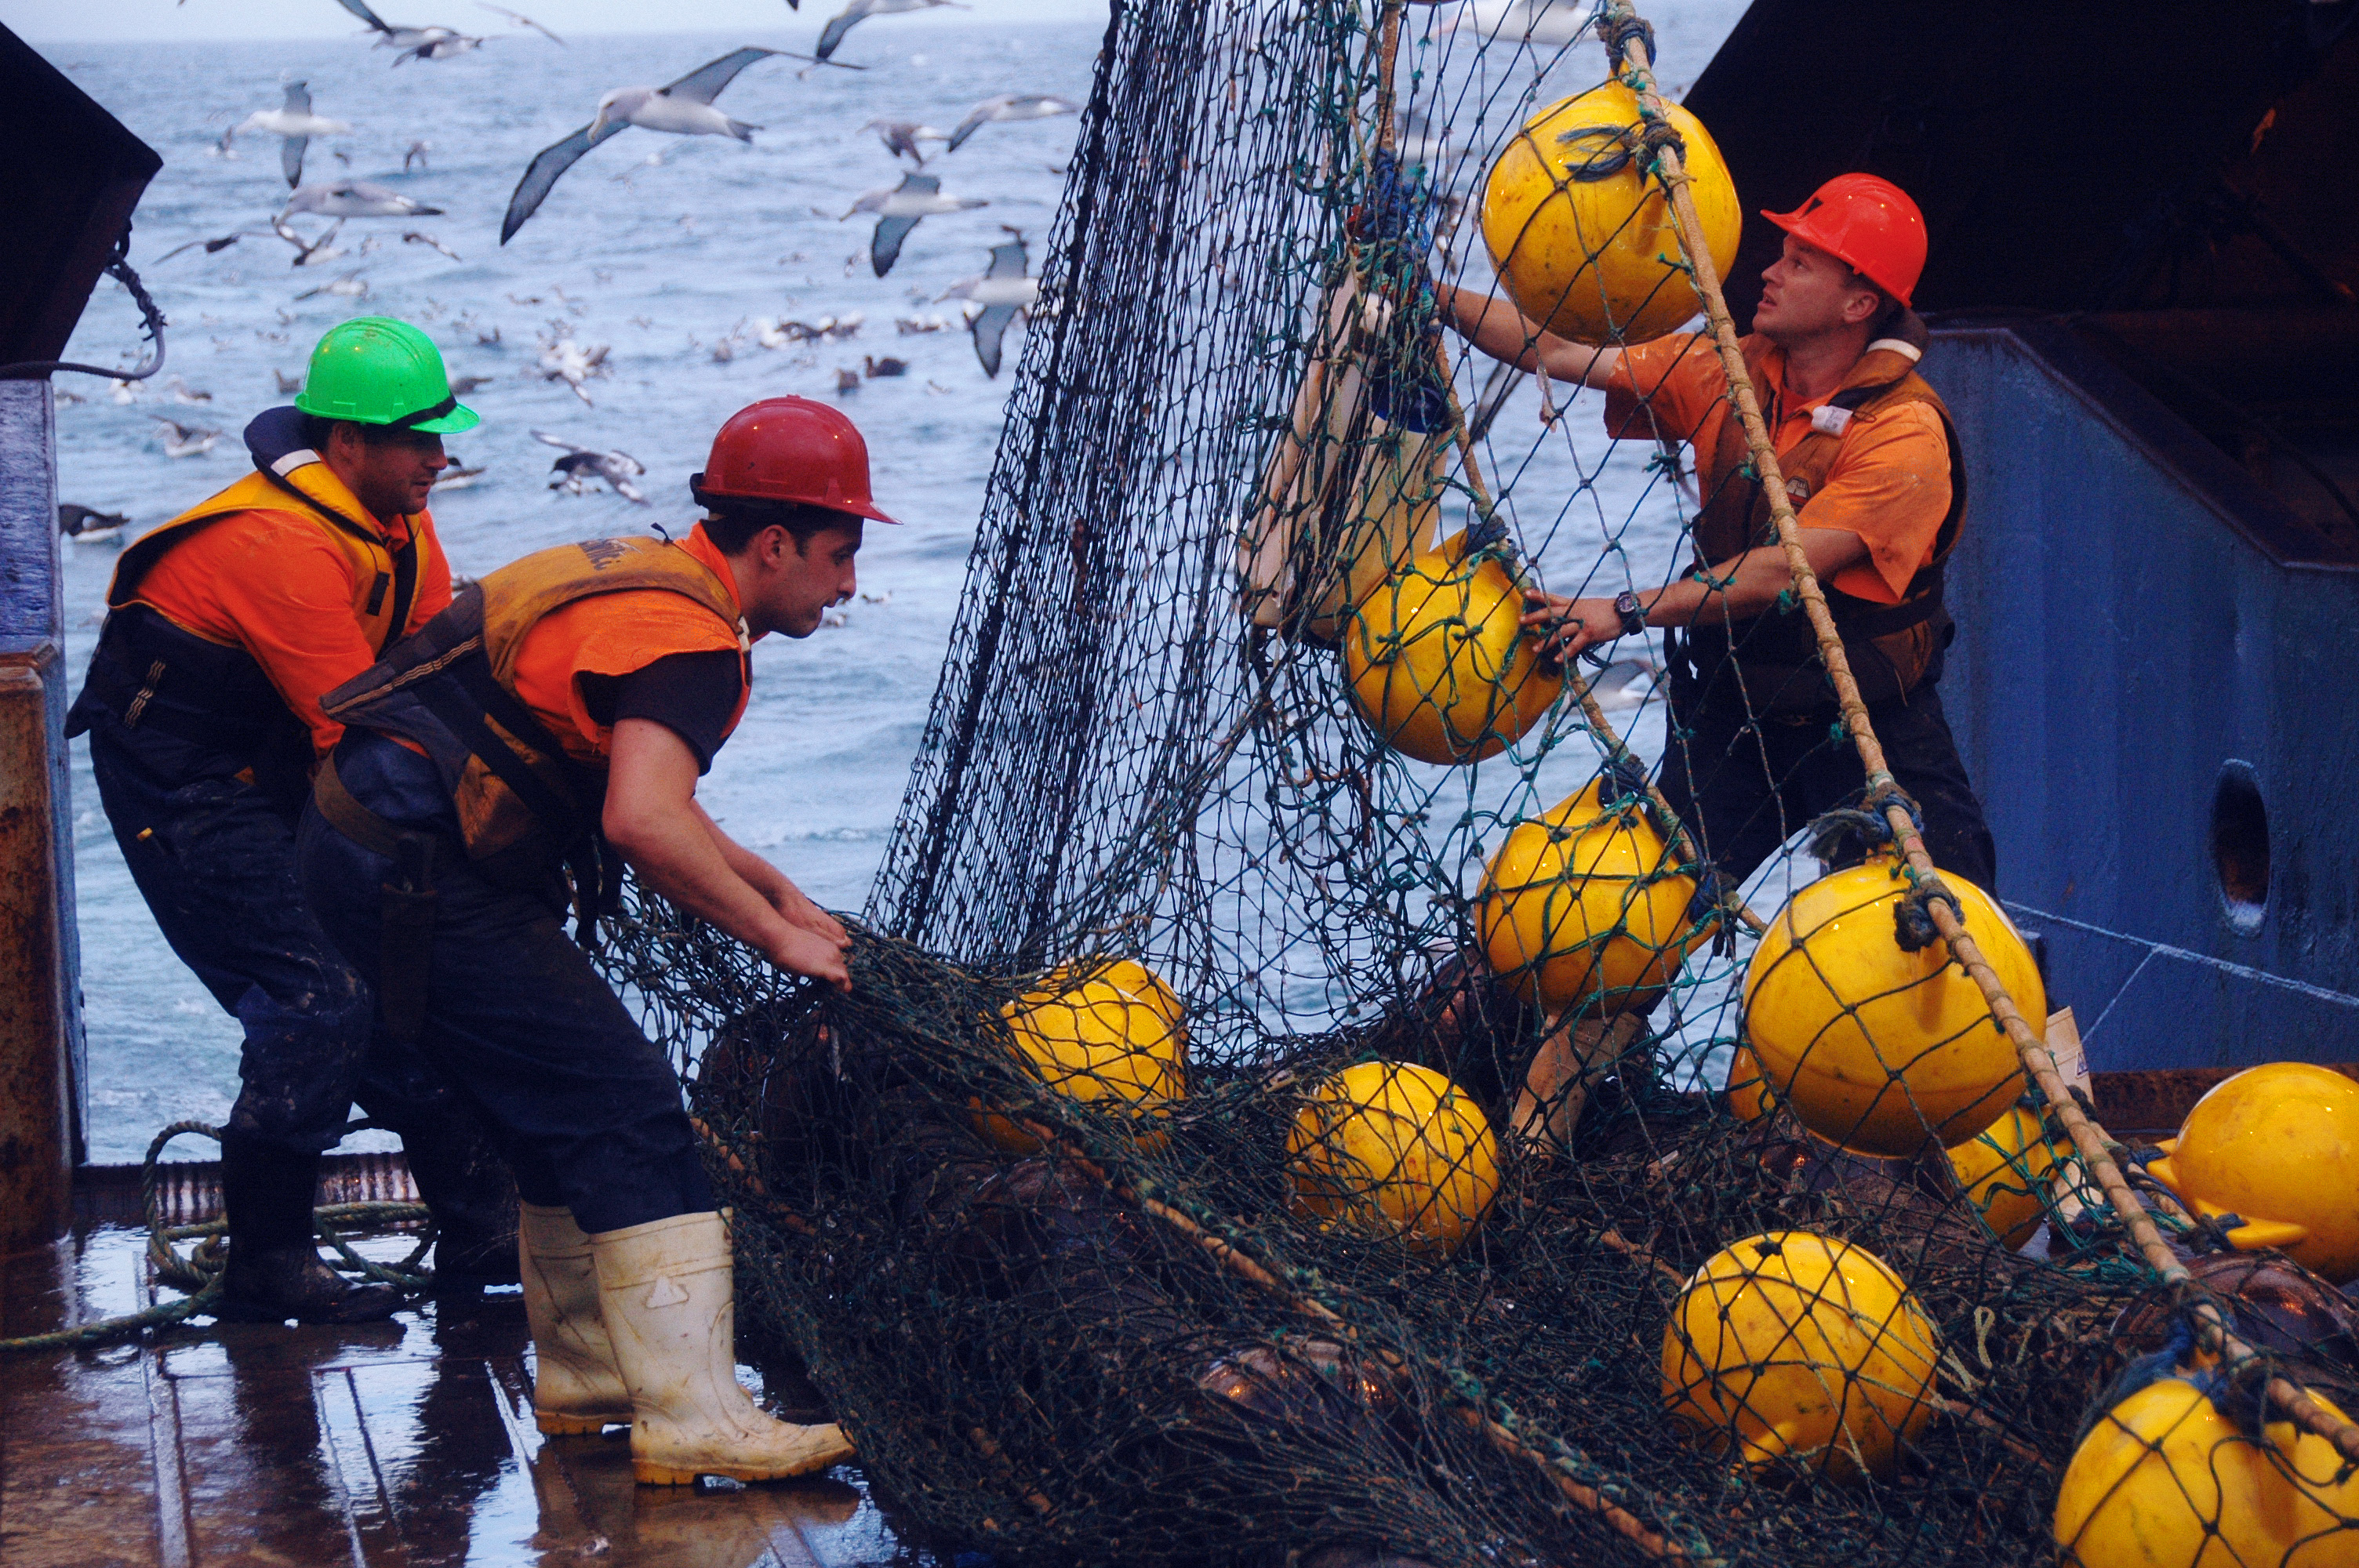
Total landings or catch provides information on the impact of fishing on the population. It is an essential input into any fisheries assessment model. In New Zealand, catch information from the commercial fleet comes from statutory reporting of catches, combined with MPI observer's estimates of discards and other unreported catch.
Recreational catch estimates are made from focused scientific studies using sampling methods such as national surveys, boat ramp surveys and aerial observation.
Where there is uncertainty of the amount of catch, we run alternative models to see what impact this has on the results.
Abundance indices
Measures of relative or absolute abundance provide us with signals that tell us when the stock size changes. Typically these are derived from catch-rate analyses of commercial catch and fishing effort data, scientific research surveys or tag-recapture experiments. Abundance observations are the most useful form of data we have because they give direct information on the changes in stock size.
Abundance indices can include catch-per-unit-effort (CPUE), trawl surveys and acoustic surveys.
CPUE is the quantity of fish (numbers or biomass) caught with a standard unit of fishing effort (e.g., the number of fish taken per 1000 hooks per hour, or the weight of fish taken per hour of trawling with a net of a fixed size each year). For a standard unit of effort applied to a given fish stock, we assume that the expected catch is proportional to the stock biomass. This implies that if the stock biomass halves over time, then so will the expected catch for a given standard unit of effort.
Abundance indices from scientific research surveys provide the most useful indicators of changes in stock size because they are observations that are often free from many of the biases found in data like CPUE indices collected from fisheries that mostly focus on fishing 'hotspots'.
Age data
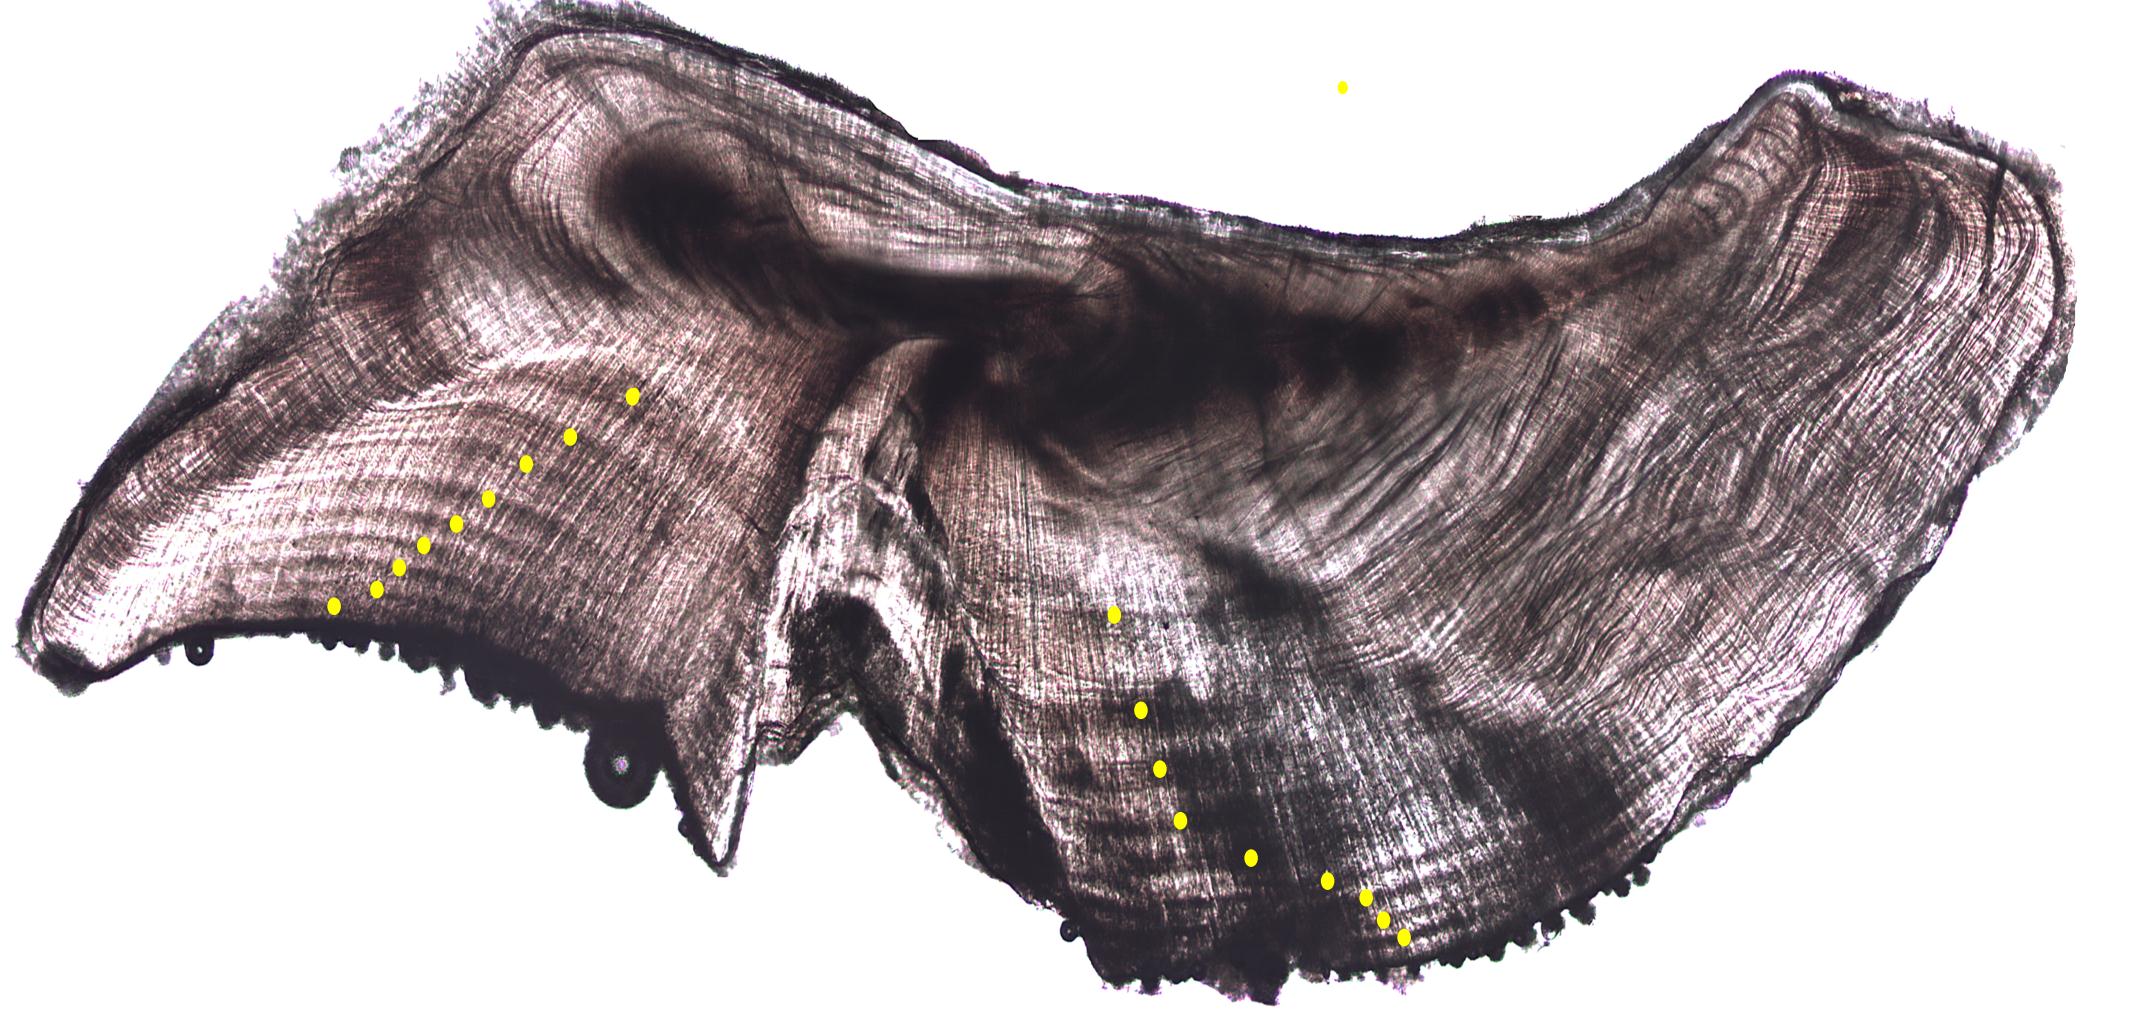
The age of a fish can be determined by examining its internal ear bone, called the otolith. By carefully preparing and sectioning an otolith, the internal structure can be seen (sometimes by eye, but usually with a microscope) and counts of the annual rings (much like the growth rings of a tree) can be used to determine the age.
Read about how we determine the age of fish
The otoliths are collected by both MPI observers from commercial vessels, and by scientific researchers from landed samples or from scientific research samples.
Otoliths from most of New Zealand's fisheries have been collected and are stored at NIWA. Currently, NIWA has otoliths from about 1.3 million fish collected from 160 species in New Zealand, with biological measurements taken from more than 15 million fish from over 500 species.
Age and length structure
Recruitment is the number of larvae that survive and develop into juvenile fish, and is influenced by the size of the spawning stock and a range of local environmental changes. Observations on the age or length structure of the population assists us in understanding what part of the population is changing, and how recruitment or fishing has changed the underlying population structure.
These observations are usually collected by MPI observers or from NIWA's scientific research voyages and studies. Changes in the age and length structure reveal the occurrence of different recruitment strengths (different relative recruitment from year to year), and also changes in targeting or selectivity in some fisheries.
These are also used in conjunction with age data to calculate the length or weight of a fish at a given age, and help calculate the total biomass of fish in the stock.
Fecundity, growth, and maturation
We also collect a lot of information on the fecundity (e.g., the number of eggs and larvae produced by each adult fish), growth rates and maturation of fish. These data provide us with information that allows us to calculate how productive a stock is.