Background
Up until the end of last century, the rate of sea-level rise has been relatively slow. This meant that planning and engineering design rightly focused on extremes due to climate variability. For example, designing for an average recurrence interval (ARI) event of 50 or 100 years, for parameters such as water level, flood levels or rainfall which remained stationary (i.e., no trend) with time. However as the rise in sea level continues to accelerate, there is an increasing imperative to consider the effects of climate variability on top of a rising trend when planning for future development. This upwards trend also means the definition of realistic (rather than nominal) planning timeframes becomes much more important than it was in the past.
The case study
This case study was designed to demonstrate methods for calculating such values as the mean high water spring tide exceeded 10 percent of the time (MHWS10), which is often used as a practical high tide level for infrastructure design works, and also for estimating extreme high (e.g. the 100-year Average Recurrence Interval) storm tides.
Estimates of sea level rise can be superimposed on these tide levels and maps of potential future coastal inundation can be produced. Using a hazard/risk model, estimates can then be made of the potential damage to buildings and repair costs associated with the inundation maps. The table below lists the Tools associated with this Case Study and the location (Figures / Tables) of any key findings.
Tools associated with the Avon-Heathcote sea level rise case study*
| Tool Name | Tool Reference | Key Figure / Table |
|---|---|---|
| Sensitivity Matrix Tool for Assessing Vulnerability of Urban Environments to Climate Change | [Tool 1.6] | Appendix: Christchurch sensitivity matrix. Coastal inundation and erosion was identified as a significant vulnerability. |
| Causes of sea level variation | [Tool 2.2.2] | Figure 2.1: High tide exceedance at Sumner Head relative to gauge zero. This figure is used to identify the present-day Mean high water springs 10 (MHWS10) sea level (1.15m), upon which projections of sea level rise were added. |
| Guidance on assessing extreme sea level in New Zealand | [Tool 2.2.3] | Table 1.2: Comparison of AMM, POT and EST extreme value estimates of Sumner Head sea levels. (AMM is the Annual Maxima Method; POT is the Peaks-Over-Threshold method; and EST is an Empirical Simulation Technique). This table is used to identify the present-day 100 year ARI storm tide (the POT central estimate of 1.88m was used in this case), upon which projections of sea level rise were added. |
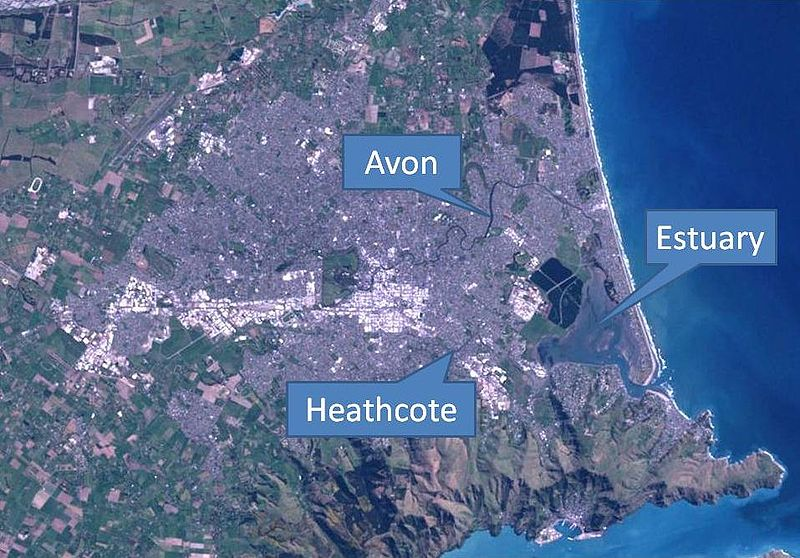
| Inundation mapping of future high tides, SLR and storm surge | [Tool 2.2.4] | Figure 3.1: Sea water inundation around the Christchurch Estuary based on the current (2010) and future (2040 and 2090) mean high water springs tide exceeded 10% of the time, and the 100-year ARI storm tide. This figure shows the areal extent of coastal inundation for the present-day and future scenarios used. The inundation data was used to estimate damage costs using Riskscape. |
An impacts analysis using Riskscape (not reported in any of the Tools; using pre-earthquakes elevation data) showed that a sea level rise of +0.4m by 2040 and +0.8m by 2090 on the 100-year average recurrence interval storm tide inundation in the Christchurch estuary area (2010 base case, +1.88m above mean sea level) [Tool 2.2.4; Figure 3.1] could result in an increase in total buildings flooded of +16% (2040 case) and +31% (2090 case). The corresponding estimated increase in replacement costs (2010 dollars) to flooded building contents is NZ$630M (2040 case) and NZ$1.2B (2090 case).
* Tidal data (Lyttleton Vertical Datum 1937) from Sumner Head for the period June 1994 to July 2009 were analysed for this case study.
Related links
- Other Urban Impacts Toolbox case studies
- Climate variability and change
- NZ temperature record
- Climate change scenarios for New Zealand