2020: New Zealand’s 7th-warmest year on record
|
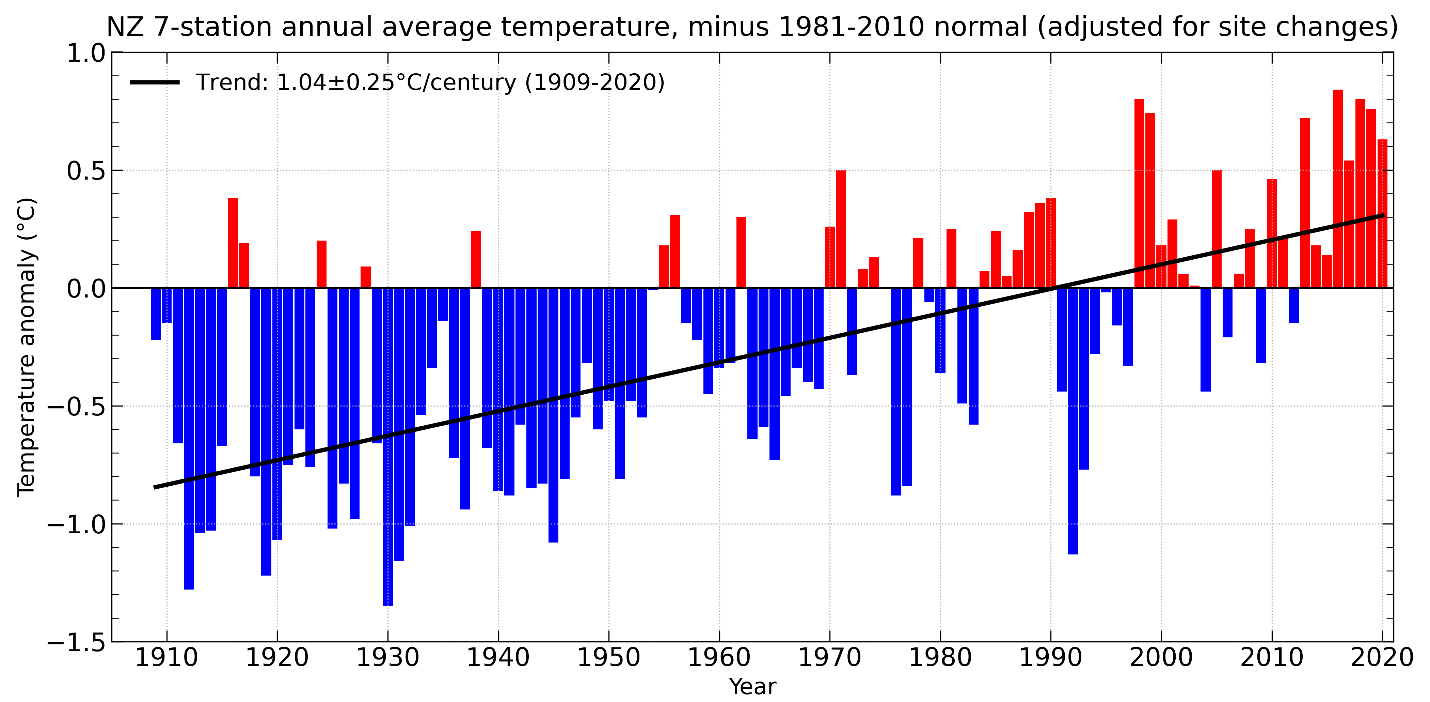
Temperature |
Annual temperatures were above average (+0.51°C to +1.20°C above the annual average) across much of the North Island, and parts of every South Island region. Near average (within -0.50°C to +0.50°C of average) temperatures occurred in Southland, eastern and inland Otago, coastal Canterbury, West Coast, Marlborough, coastal parts of the lower North Island, and the Central Plateau. 2020 was the 7th-warmest year on record for New Zealand, based on NIWA’s seven-station series which began in 1909. |
|
Rainfall |
Annual rainfall was below normal (50-79% of normal) across many northern, eastern and inland parts of the North Island, and parts of Marlborough, Canterbury and eastern Otago. Rainfall was near normal (80-119% of normal) for most remaining areas of the country including eastern parts of Northland, the Central Plateau, western and southern parts of the North Island, Nelson, West Coast, inland Otago and Southland. |
|
Soil moisture |
A dry start to the year contributed to drier than normal soils across much of the country during summer. By the end of February, severe meteorological drought was in place across Northland, Auckland, much of Waikato, western Bay of Plenty, East Cape, and southern Marlborough, while meteorological drought was found from Gisborne to Bay of Plenty and south to Manawatū-Whanganui and eastern Taranaki. Soil moisture levels returned to near normal for many areas during the middle of the year, but by the end of spring drier than normal soils were present for northern parts of the North Island and southern parts of the South Island. By the end of December, soils were drier than normal for the upper North Island, but wetter than normal for coastal areas from Taranaki through to Wellington, the Nelson-Tasman region and northern Otago. |
|
Sunshine |
The Bay of Plenty experienced New Zealand’s highest annual sunshine total during 2020 (2704 hours recorded at Whakatāne). |
Overview
2020 was Aotearoa New Zealand’s 7th-warmest year on record. The nationwide average temperature for 2020, calculated using stations in NIWA’s seven-station temperature series which began in 1909, was 13.24°C (0.63°C above the 1981–2010 annual average). New Zealand’s hottest year on record remains 2016, when the nationwide average temperature was 13.45°C (0.84°C above the 1981–2010 annual average). Based on the seven-station series, 2020 featured six months with above average temperatures (greater than +0.50°C of average), six months with near average temperatures (within -0.50°C to +0.50°C of average), and no months with below average temperatures (less than -0.50°C of average). It has now been 47 months since New Zealand has had a month with below average temperatures (the last such month was January 2017). Furthermore, six of the past eight years have been amongst New Zealand’s hottest on record. This trend is consistent with the overall pattern of global warming.
The hottest spell of the year took hold over New Zealand from late-January to early-February, with several locations observing their highest daily maximum and daily minimum temperatures on record. The highest temperature of 2020 was recorded on 31 January at Gisborne. The maximum temperature there reached 38.2°C, which is New Zealand’s 5th-highest January temperature on record, and the country’s 19th-equal hottest temperature on record for all months. This period of warmth coincided with the latter stages of an extended dry spell for many areas of the country. Several locations observed dry spells of at least 40 days (see Drought and low rainfall section of this summary for further details). Most notably, a 64-day dry spell was recorded in Blenheim. It lasted from 20 December 2019 to 21 February 2020, making it the longest dry spell on record at the town.
From late-March to late-April, high pressure prevailed over the country, delivering mild and very dry conditions for many areas. Several locations in Wairarapa, coastal Marlborough and coastal North Canterbury recorded less than 5 mm of rain during April. It was a continuation of the dry start to the year for parts of Northland, Auckland, Waikato, Bay of Plenty and Hawke’s Bay, where January-April rainfall totals were less than 40% of normal, respectively. A key contributing factor to the year’s dry start was a near-record positive Indian Ocean Dipole. This persisted from late-2019 into early-2020, preventing plumes of tropical moisture (known as “atmospheric rivers”) from forming north of the country. Atmospheric rivers are an important moisture source for New Zealand, but these were largely non-existent over the country in late-summer and early-autumn.
Winter was much wetter than usual in northern parts of the North Island, which saw soil moisture levels return to near normal after the persistent dryness observed earlier in the year. Seasonal snow experienced a marked mid-winter hiatus, with very little snowfall at most of NIWA’s high elevation observation sites from late-July through much of August. At the end of August, the depth of accumulated snow at Mueller Hut near Mt Cook was the lowest in 10-years of record, with less than 45% of average depth. Several ski areas in Canterbury struggled to operate throughout the season due to a lack of snow. This was largely as a result of abnormally warm temperatures, with New Zealand observing its warmest winter on record. New snowfall in late-winter and early-spring brought snow depths up to average for the time of year at most of NIWA’s high elevation observation sites. It took until late-September for the coldest outbreak of the year to occur. Snow fell to sea level in Southland and Otago during this time, and daytime temperatures on 29 September struggled to exceed 0°C for coastal parts of these regions.
October and November were warm months for the country, with the former month featuring mostly dry conditions. A large fire fanned by strong winds struck Lake Ōhau Alpine Village in early October, which destroyed approximately 50 homes. In contrast to the dryness of October, November was quite a wet month for much of the country. An exceptional heavy rain event occurred in Napier, with 242 mm of rain recorded on 9 November. It was the city’s 2nd-wettest day on record, with records beginning in 1870. Napier ended the month with 325 mm of rain: 601% (i.e., 6 times) of normal for November. A lack of rainfall contributed to dry conditions in December for northern parts of the North Island, with water restrictions introduced for several towns in the Far North, and Tauranga establishing a ban on the use of sprinklers.
For 2020 overall, the New Zealand region had an average mean sea level pressure (MSLP) of 1015.4 hPa, 1.3 hPa above the long-term 1981-2010 average. This was the 6th-highest annual MSLP value observed in the New Zealand region since records began in 1948. The Southern Annular Mode (SAM), a ring of Southern Hemisphere climate variability, was positive 61% of the time during 2020. The positive SAM phase is associated with higher than normal air pressure around New Zealand, which tends to bring more tranquil weather conditions to the country. However, Wellington was an exception in September: the monthly mean wind speed was 24.8 km/h, making it the city’s highest monthly mean wind speed since October 2009.
Early in the year, the El Niño Southern Oscillation (ENSO) phase was neutral. This phase persisted through May, before an increase in tropical trade winds contributed to cooling ocean temperatures about the equatorial Pacific. Accordingly, a La Niña Watch was put into place in June, which transitioned to a La Niña Alert in August as the atmosphere began to respond to the changes in the tropical Pacific Ocean. For New Zealand, air flow anomalies transitioned to northeasterly during winter, which persisted in the North Island through spring — a traditional hallmark of La Niña. In October, La Niña conditions were officially acknowledged and continued through the end of the year.
Download
- Download the 2020 New Zealand Annual Climate Summary [PDF 1.64 MB]