2019: New Zealand’s 4th-warmest year on record
|
Temperature |
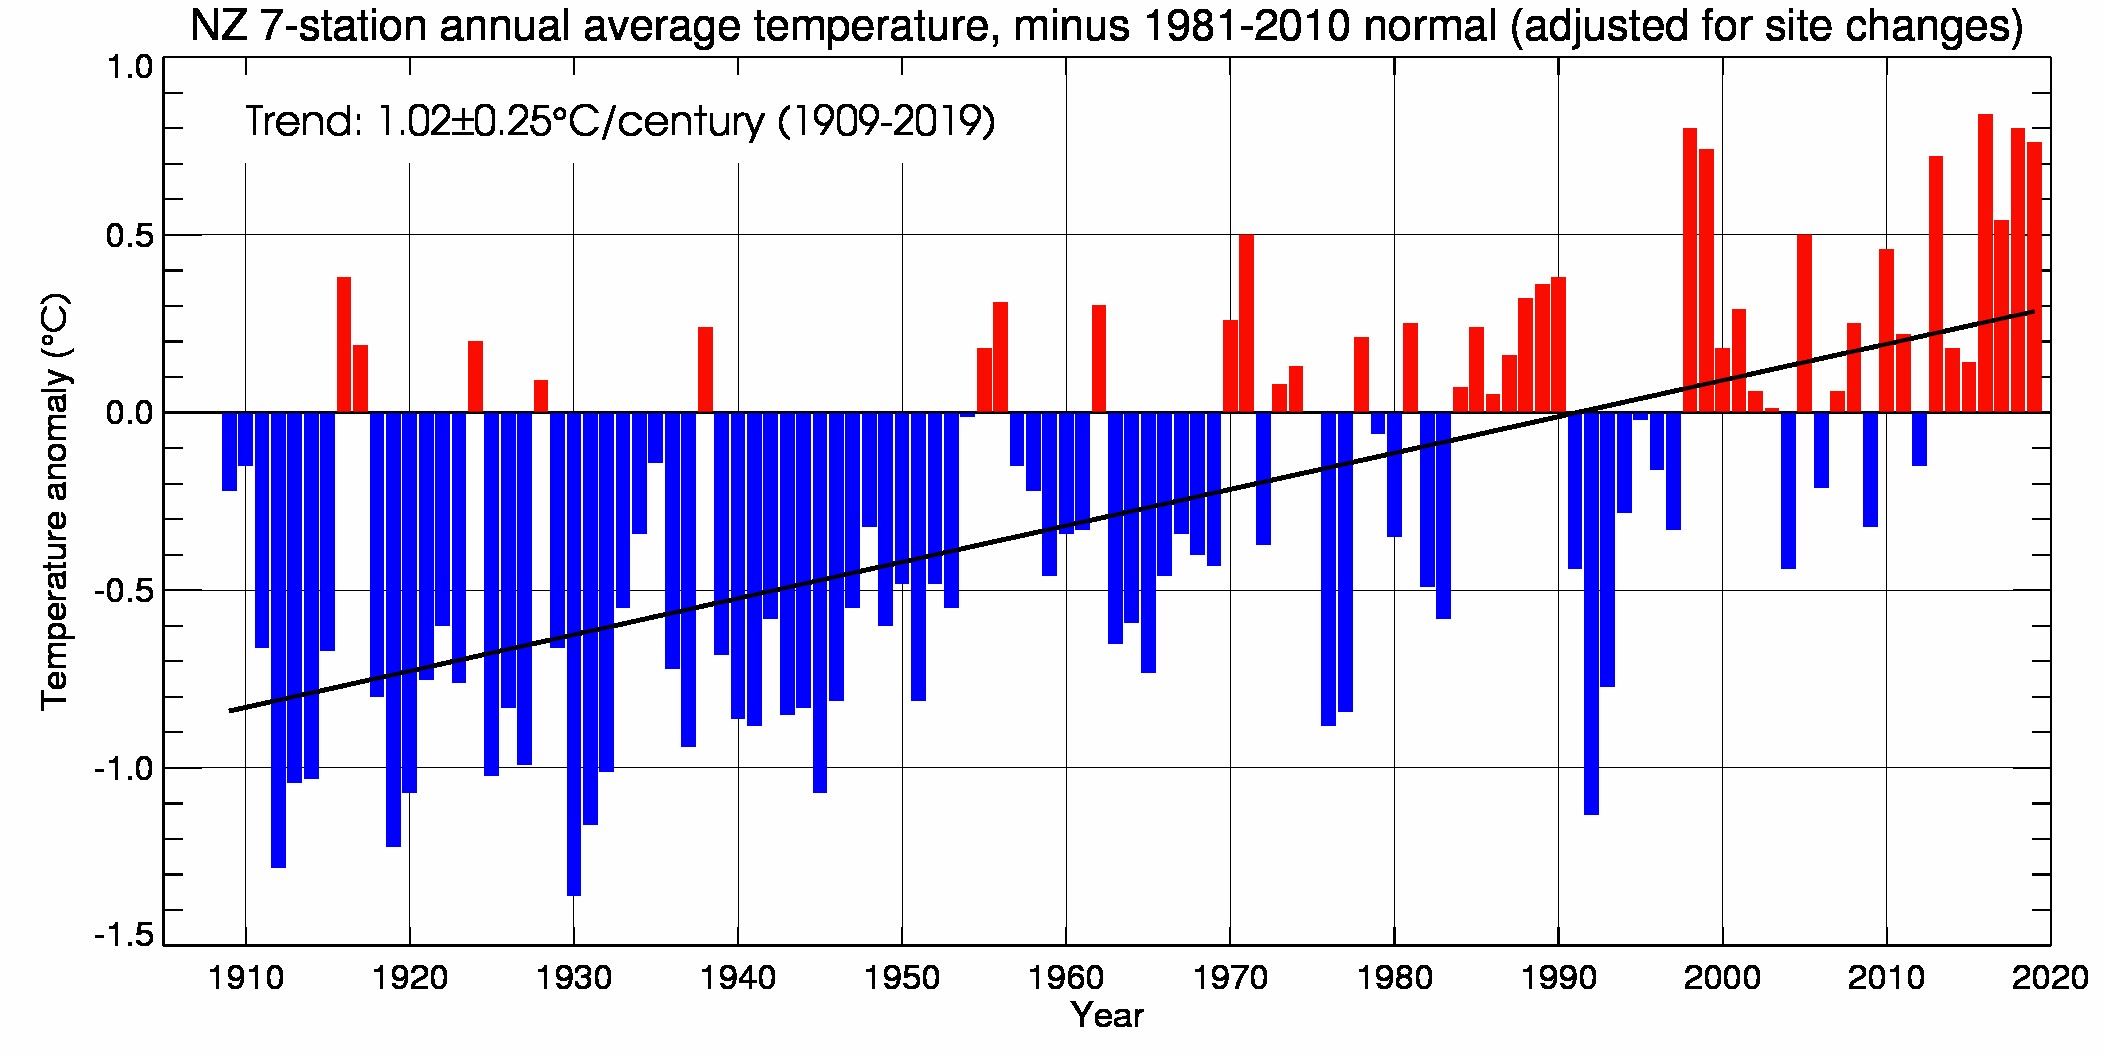
Annual temperatures were above average (+0.51°C to +1.20°C above the annual average) across the majority of New Zealand. Pockets of well above average (>1.20°C from average) temperatures were observed in the Bay of Plenty and Hawke’s Bay. Near average (within -0.50°C to +0.50°C of average) temperatures occurred in parts of the Wairarapa, the West Coast, Tasman, Nelson, Marlborough and coastal Canterbury. 2019 was the 4th-warmest year on record for New Zealand, based on NIWA’s seven-station series which began in 1909. |
|
Rainfall |
Yearly rainfall in 2019 was below normal (50-79% of normal) across Northland, Auckland, the Bay of Plenty as well as parts of Waikato, Hawke’s Bay, the Wairarapa and Marlborough. Conversely, rainfall was above normal (120-149% of normal) in western Southland and parts of Westland. Rainfall was near normal (80-119% of normal) for the remainder of New Zealand. |
|
Soil moisture |
A dry and warm January led to the rapid depletion of soil moisture levels, which continued throughout February with drier than normal soils present across much of the country by the end of summer. Below normal soil moisture levels continued into autumn for the North Island, while heavy rain during the end of March contributed to soils becoming wetter for western parts of the South Island. By the end of winter, soil moisture levels were near normal for most of the country. Soil in the North Island began to dry out again during spring. At the end of spring 2019, soil moisture levels were below normal for much of the upper and eastern North Island, along with scattered portions of Tasman, Marlborough and Canterbury. Above normal soil moisture levels were observed in the lower west coast of the North Island and in parts of Otago and Southland. As of 1 January 2020, soils were wetter than normal for the time of year across parts of Southland, Otago, Nelson, Marlborough Sounds and Wellington. Soil moisture levels were much lower than normal for the time of year in Northland, Auckland, northern Waikato and eastern parts of Wairarapa. |
|
Sunshine |
The wider Nelson region experienced New Zealand’s highest annual sunshine total during 2019 (2859 hours recorded at Richmond). |
Overview
2019 was New Zealand’s 4th-warmest year on record. The nationwide average temperature for 2019, calculated using stations in NIWA’s seven-station temperature series which began in 1909, was 13.37°C (0.76°C above the 1981–2010 annual average). 2016 remains NZ's hottest year on record which had a nationwide average temperature of 13.45°C (0.84°C above the 1981–2010 annual average). The years 1998 and 2018 were tied at 2nd-equal (0.80°C above the 1981–2010 annual average).
The year began with New Zealand’s 3rd-warmest January on record. Widespread heatwave conditions took hold during the end of the month with several locations experiencing their warmest January day on record. The warmest temperature of 2019 was recorded on 31 January at Hanmer Forest. The high of 38.4°C became New Zealand’s 18th-equal warmest temperature on record for all months (See Significant Weather and Climate Events in 2019 for further details).
A central Pacific El Niño event (which persisted through to July) brought frequent bouts of high pressure with widespread sunny and dry weather to start the year. By the end of February, Nelson observed a 40-day dry spell which was the 4th-longest dry spell on record there (with records extending back to 1862), while Tauranga and Hamilton had 36 consecutive dry days – their 3rd-longest dry spells on record (records began in 1910 and 1935, respectively). The dryness contributed to multiple fires arising during February. Most notably on 5 February, tinder-dry conditions in the Tasman District fuelled a large scrub fire in Pigeon Valley near Wakefield. The fire doubled in size overnight, spreading to cover 1870 hectares within a perimeter of 20 km by 3 a.m. on 6 February. A Civil Defence State of Emergency was declared which lasted until 27 February. It was reportedly the largest aerial firefight in New Zealand's history, with 23 helicopters and two planes used at the peak of the fire.
A key climate driver and contributor to NZ’s hot start to 2019 was the presence of above average sea temperatures around our coastlines. Some coastal areas around Hawke’s Bay and Canterbury experienced marine heatwave conditions for a time and marine heatwave conditions also persisted in the Tasman Sea through to March. Warmer than average seas contribute to warmer than average temperatures on land but can also provide extra energy for passing storms (all else being equal, increased surface fluxes of latent and sensible heat can provide potential energy to storms). An example of this occurred on 25-27 March when a mix of an ‘atmospheric river’ , extending from Australian cyclones, coupled with extra energy from the Tasman Sea marine heatwave, as well as a strong low-pressure system siphoning moisture toward New Zealand, brought extremely heavy rainfall to the western South Island. A State of Emergency was declared in Westland and the Waiho River bridge on State Highway 6 was claimed by raging floodwaters. Between 25–27 March, a New Zealand 48-hour rainfall record was set at the Hokitika catchment of the Cropp River which recorded 1086 mm, or more than a metre of rain.
Warmth and dryness remained a theme into winter. It was NZ’s 4th-warmest autumn and 7th-warmest winter on record. It was also the driest January to June on record for Auckland (321.2 mm, 62% of normal), Hamilton (275.8 mm, 53% of normal), Whangārei (277.8 mm, 44% of normal), Whitianga (332.8 mm, 39% of normal), and Kaitaia (238.4 mm, 36% of normal). In Auckland, Watercare urged residents to use water wisely at the start of July as water storage was 25% less than normal for the time of year. Snow events were infrequent during the winter season and instead the warm and settled weather during June and July resulted in frequent fog events and disruptions at airports.
A strongly negative Southern Annular Mode at the start of August and stronger than normal polar and sub-tropical jet streams fuelled a more active weather pattern to end winter. The cooler temperatures at the end of winter and start of spring were also influenced by a rare major Sudden Stratospheric Warming (SSW) event, which occurred in the polar stratosphere during late-August and peaked in mid-September (this was the Southern Hemisphere’s strongest SSW on record and just the second major event on record). Despite several sharp cold snaps, temperatures as a whole were near average for the time of year in September and continued on the near average note in October, before prevailing northwesterlies in November brought unseasonably warm temperatures and New Zealand’s warmest November on record.
Another key climate driver during spring 2019 was a strongly positive Indian Ocean Dipole (IOD) event in October and November. The IOD’s hallmark is cooler than average sea surface temperatures in the eastern Indian Ocean near Indonesia and warmer than average sea surface temperatures in the Arabian Sea. This particular IOD event was of near-record strength and caused abnormally dry conditions across Indonesia and Australia during the end of 2019 (and contributed to Australia’s dangerous fire conditions). For New Zealand, it brought more westerly quarter winds than normal during spring, from cooler, drier southwesterlies in October to warm, moist northwesterlies in November. The year ended on a cool and wet note in the South Island. During the first eight days of December, a prolonged period of northwesterly airflows over the country delivered persistent rainfall to the headwaters of the South Island lakes and rivers. Lake Wanaka and Lake Wakatipu rose considerably, inundating lakeside roads, tracks and reserves. Meanwhile a dry December for the upper North Island led to rapidly depleting soil moisture levels to start the new decade.
Overall, annual mean sea level pressures for 2019 were slightly lower than normal over the South Island and south of the country while higher than normal pressures occurred over the Tasman sea. This atmospheric pressure pattern produced slightly more westerly wind flows than normal for the year. Frequent bouts of high pressure contributed to a sunny year. The wider Nelson region experienced New Zealand’s highest annual sunshine total during 2019 (2859 hours recorded at Nelson), followed by Marlborough (2799 hours - Blenheim) and Hawke’s Bay (2709 hours – Napier).
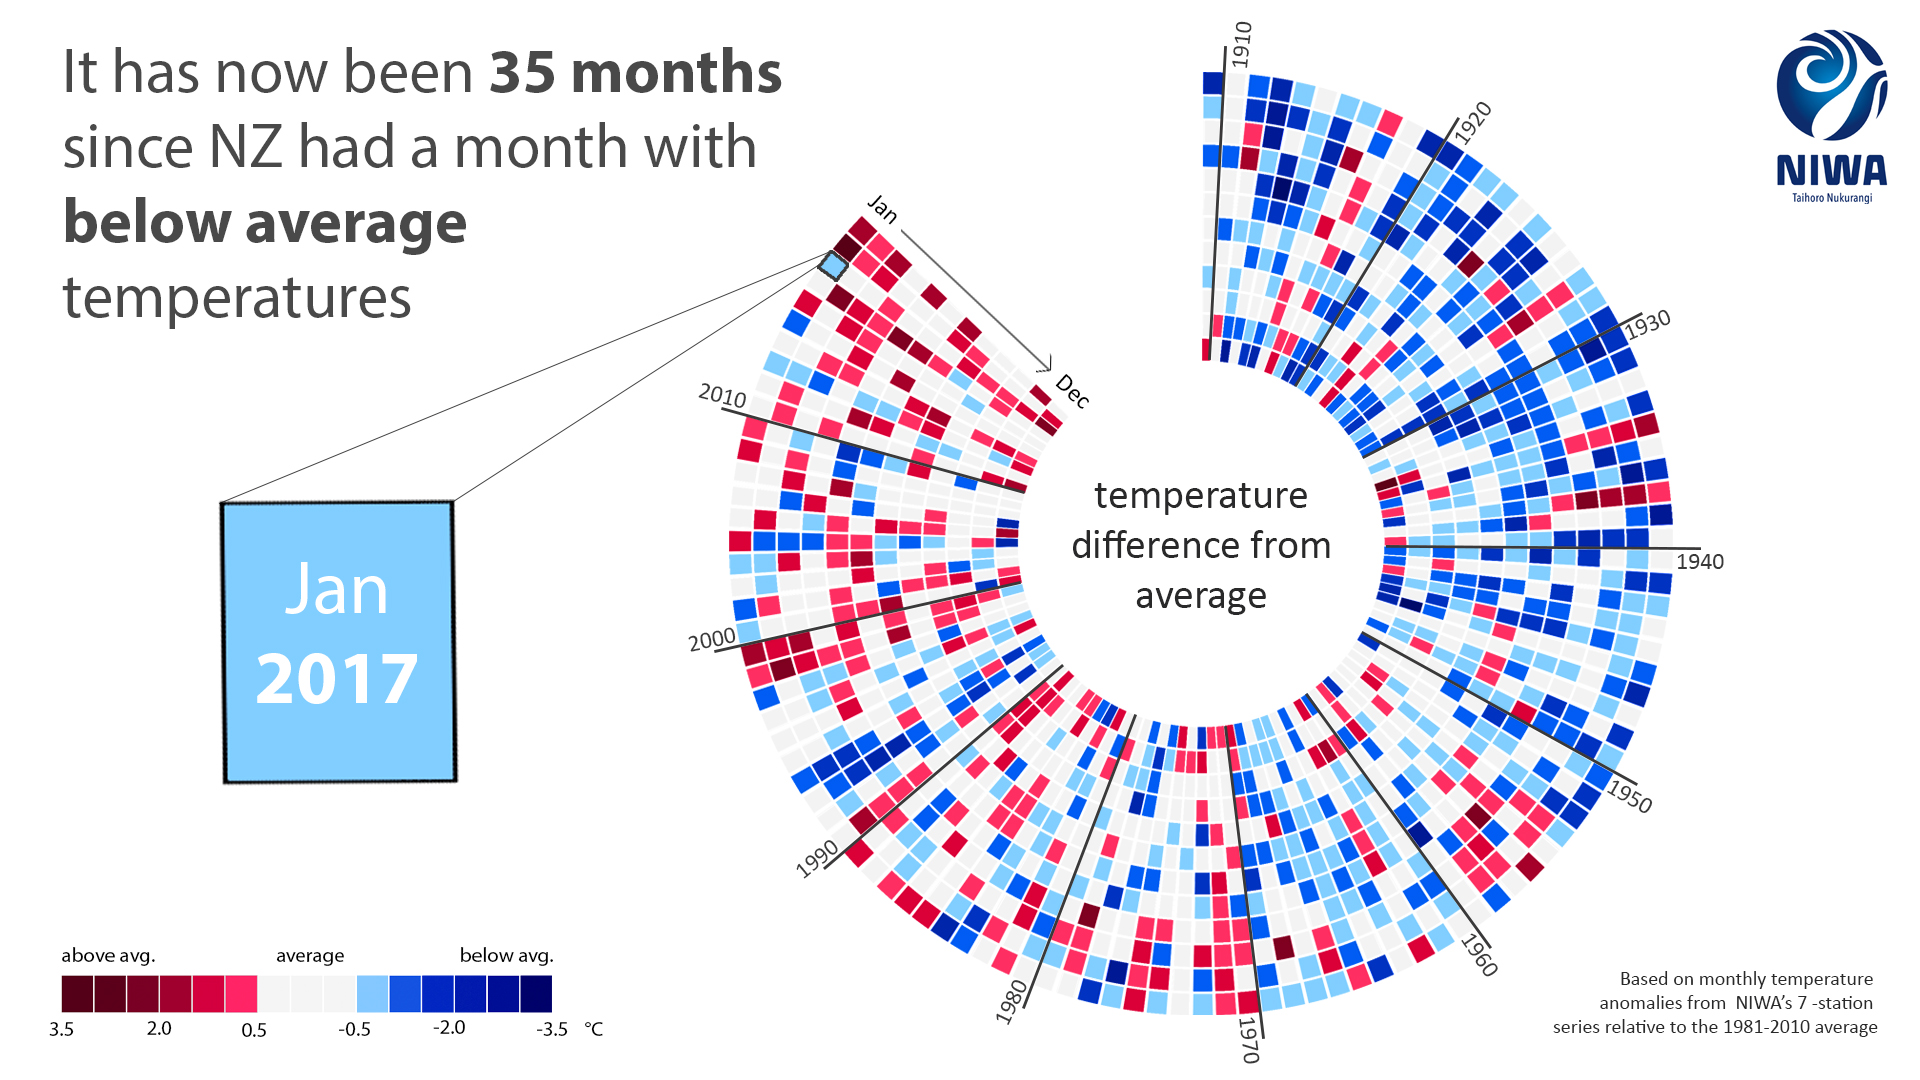
Based on the seven-station series, 2019 featured six months with near average temperatures (within -0.50°C to +0.50°C of average), six months with above average temperatures (greater than +0.50°C of average) and no months with below average temperatures (less than -0.50°C of average). It has now been 35 months since New Zealand has had a month with below average temperatures (since January 2017). Furthermore, five of the past seven years have been amongst New Zealand’s hottest on record. This trend is consistent with the overall pattern of global warming.