Overview
Many atmospheric and oceanic indicators in the tropical Pacific are on the La Niña side of neutral, although not yet strong enough to reach La Niña thresholds.
The Southern Oscillation Index has been positive for the past three months and is currently about +0.5. Tropical convection patterns show a La Niña pattern of enhanced rainfall over Indonesia and suppressed rainfall around the Dateline and eastwards. Sea surface temperatures in the central and eastern tropical Pacific have recently cooled to below normal, with the central Pacific NINO3.4 index at -0.3°C. Sub-surface tropical ocean temperatures are now more than 3°C below normal at about 100m depth and 140°W.
International forecast guidance has changed markedly in the past month. There is now a 50:50 split between the likelihood of La Niña and neutral conditions extending through to March 2018, with very little chance of El Niño development through this period.
For October – December 2017, the atmospheric circulation around New Zealand is forecast to be characterized by lower pressure than normal northwest of New Zealand and higher pressure than normal to the south and east of the country. This type of atmospheric setup, with anomalous northeasterly airflow, can produce streams of subtropical moisture towards New Zealand associated with heavy rainfalls.
Chris Brandolino, Principal Scientist – Forecasting explains the seasonal climate outlook for October-December 2017.
Outlook summary
October – December 2017 temperatures are forecast to be above average for all regions of New Zealand (55% to 60% chance for above average temperatures). However, frosts and cool snaps could occur, especially early in the outlook period. Coastal water temperatures around New Zealand are forecast to remain above average over the next three-month period.
October – December 2017 rainfall totals are about equally likely to be normal (35% chance) or above normal (40% chance) for the north of the North Island, and most likely to be near normal (45% to 50% chance) for the remainder of the North Island and the north, west and south of the South Island. For the east of the South Island, rainfall is equally likely to be near normal (40% chance) or below normal (40% chance).
October – December 2017 soil moisture levels and river flows are about equally likely to be normal (35-40% chance) or above normal (35-40% chance) for the north and west of the North Island. For the west of the South Island, soil moisture levels are most likely to be near normal (45% chance), whereas river flows are equally likely to be near normal (40% chance) or above normal (40% chance). For all remaining regions, soil moisture levels and river flows are most likely to be near normal (40-45% chance).
Regional predictions for the October – December 2017 season
Northland, Auckland, Waikato, Bay of Plenty
The table below shows the probabilities (or percent chances) for each of three categories: above average, near average, and below average. In the absence of any forecast guidance there would be an equal likelihood (33% chance) of the outcome being in any one of the three categories. Forecast information from local and global guidance models is used to indicate the deviation from equal chance expected for the coming three-month period, with the following outcomes the most likely (but not certain) for this region:
- Temperatures are very likely to be above average (60% chance).
- Rainfall totals are about equally likely to be in the above normal range (40% chance) or near normal range (35% chance).
- Soil moisture levels and river flows are about equally likely to be above normal (40% chance) or near normal (35% chance).
The full probability breakdown is:
|
Temperature |
Rainfall |
Soil moisture |
River flows |
|
|
Above average |
60 |
40 |
40 |
40 |
|
Near average |
30 |
35 |
35 |
35 |
|
Below average |
10 |
25 |
25 |
25 |
Central North Island, Taranaki, Whanganui, Manawatu, Wellington
Probabilities are assigned in three categories: above average, near average, and below average.
- Temperatures are very likely to be above average (60% chance).
- Rainfall totals are most likely to be near normal (45% chance).
- Soil moisture levels and river flows are about equally likely to be near normal (40% chance) or above normal (35% chance).
The full probability breakdown is:
|
Temperature |
Rainfall |
Soil moisture |
River flows |
|
|
Above average |
60 |
30 |
35 |
35 |
|
Near average |
30 |
45 |
40 |
40 |
|
Below average |
10 |
25 |
25 |
25 |
Gisborne, Hawke’s Bay, Wairarapa
Probabilities are assigned in three categories: above average, near average, and below average.
- Temperatures are very likely to be above average (60% chance).
- Rainfall totals are most likely to be near normal (45% chance).
- Soil moisture levels and river flows are most likely to be near normal (45% chance).
The full probability breakdown is:
|
Temperature |
Rainfall |
Soil moisture |
River flows |
|
|
Above average |
60 |
30 |
25 |
25 |
|
Near average |
30 |
45 |
45 |
45 |
|
Below average |
10 |
25 |
30 |
30 |
Tasman, Nelson, Marlborough, Buller
Probabilities are assigned in three categories: above average, near average, and below average.
- Temperatures are very likely to be above average (60% chance).
- Rainfall totals are most likely to be near normal (45% chance).
- Soil moisture levels and river flows are most likely to be near normal (40% chance).
The full probability breakdown is:
|
Temperature |
Rainfall |
Soil moisture |
River flows |
|
|
Above average |
60 |
30 |
30 |
30 |
|
Near average |
30 |
45 |
40 |
40 |
|
Below average |
10 |
25 |
30 |
30 |
West Coast, Alps and foothills, inland Otago, Southland
Probabilities are assigned in three categories: above average, near average, and below average.
- Temperatures are very likely to be above average (60% chance).
- Rainfall totals and soil moisture levels are most likely to be in the near normal range (45-50% chance).
- River flows are equally likely to be near normal (40% chance) or above normal (40% chance).
The full probability breakdown is:
|
Temperature |
Rainfall |
Soil moisture |
River flows |
|
|
Above average |
60 |
20 |
25 |
40 |
|
Near average |
30 |
50 |
45 |
40 |
|
Below average |
10 |
30 |
30 |
20 |
Coastal Canterbury, east Otago
Probabilities are assigned in three categories: above average, near average, and below average.
- Temperatures are most likely to be above average (55% chance).
- Rainfall totals are equally likely to be near normal (40% chance) or below normal (40%).
- Soil moisture levels and river flows are most likely to be in the near normal range (40-45% chance).
The full probability breakdown is:
|
Temperature |
Rainfall |
Soil moisture |
River flows |
|
|
Above average |
55 |
20 |
30 |
35 |
|
Near average |
35 |
40 |
40 |
45 |
|
Below average |
10 |
40 |
30 |
20 |
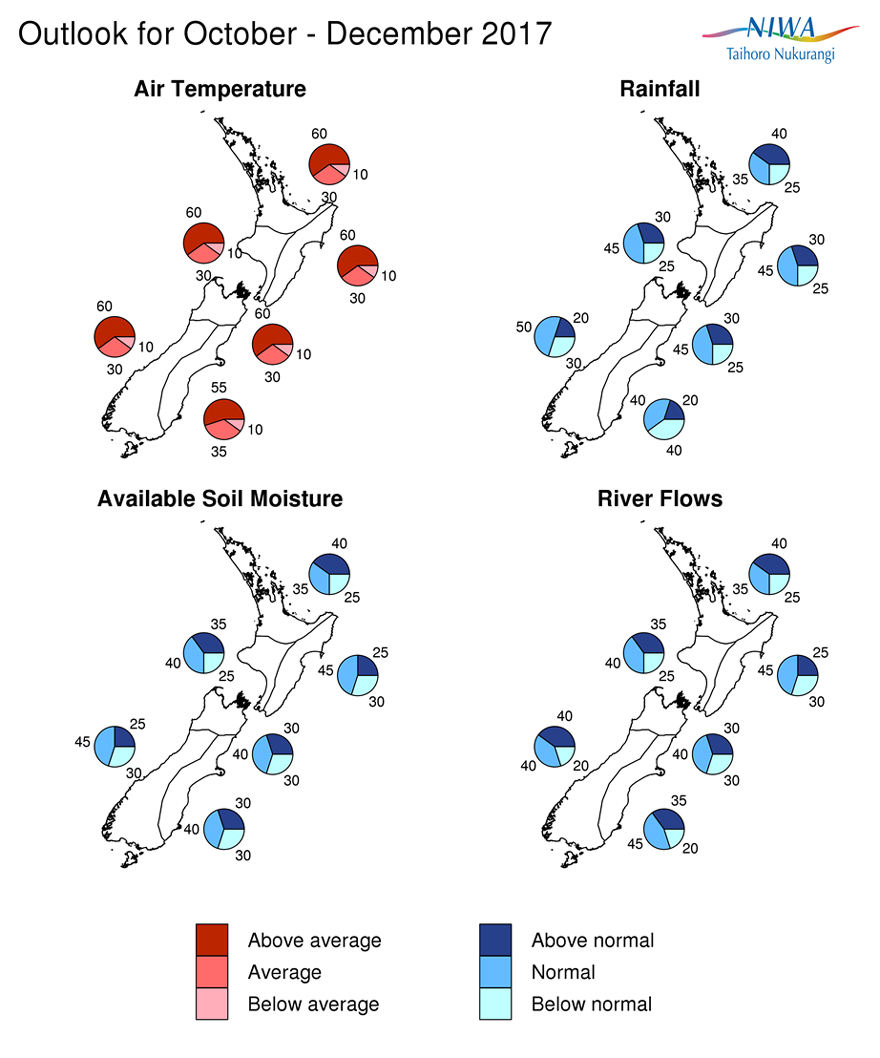
Graphical representation of the regional probabilities
Background
La Niña-like signals in the ocean–atmosphere system in the tropical Pacific Ocean have become more prominent and coherent in September 2017, although have not yet reached the thresholds required for a La Niña event to be declared.
Sea surface temperatures (SSTs) in the central and eastern equatorial Pacific Ocean cooled substantially during September. In mid-August, NINO3 and NINO3.4 were near zero, and NINO4 positive. By mid-September, NINO3 and NINO3.4 were 0.3 to 0.4 degree cooler than normal, and NINO4 close to normal. The lowest SST anomalies have also shifted away from the coast (NINO1+2) into the eastern and central tropical Pacific.
Subsurface ocean temperatures in the first 150 meters of the ocean in the central and eastern equatorial Pacific (east of about 150°W) also cooled significantly during September, having become progressively cooler each month from July. Ocean temperatures are now more than 3°C below normal at about 100m depth and 140°W. Meanwhile, waters in the western Pacific (west of about 170°W) remain above normal by up to 1°C – a La Niña-like signature.
The Southern Oscillation Index (SOI) for the month of September 2017 was positive at +0.5, on the La Niña side of neutral, but little changed from August. Zonal wind anomalies along the equator have become more negative in the central and western equatorial Pacific during September, indicating enhanced trade-winds and a pattern which is consistent with a positive SOI. Moreover, rainfall and convection anomalies in the tropical Pacific have become more La Niña-like than they were in August.; that is, enhanced convection over the Maritime Continent and drier than normal conditions about and east of the Dateline.
The Intertropical Convergence Zone (ITCZ) was displaced north of its climatological position along its entire length across the tropical North Pacific, a typical response to stronger easterly trade winds during La Niña periods. The South Pacific Convergence Zone (SPCZ) remained suppressed in September 2017, with few areas apart from French Polynesia receiving above normal rainfall during the month. The ENSO Precipitation Index (ESPI) is currently negative with a value near -1.4. The negative values over the past three months (below -1) are indicative of a La Niña-like state.
International forecast guidance has changed markedly in the past month. Previously, there was a strong consensus for continuation of ENSO-neutral conditions. Now there is a 50:50 split between La Niña and neutral conditions being forecast through to March 2018, with very little chance of El Niño development (<5%) through this period.
Coastal waters remain generally warmer than average all around the country, although the anomaly in the “NZ box” (160°E-170°W, 30-45°S) has weakened from last month to its current value of about +0.3oC. Ocean waters are especially warm, relative to the average for this time of year, around the Chatham Islands and south of New Zealand. The dynamical models’ forecasts indicate that warmer than average SSTs around New Zealand are likely to persist over the October – December 2017 period.
Contact
For comment, please contact
Chris Brandolino, Principal Scientist – Forecasting, NIWA National Climate Centre Tel (09) 375 6335.
Dr Brett Mullan, Principal Scientist, NIWA National Climate Centre Tel (04) 386 0508.
Notes to reporters and editors
- NIWA’s outlooks indicate the likelihood of climate conditions being at, above, or below average for the season as a whole. They are not ‘weather forecasts’. It is not possible to forecast precise weather conditions three months ahead of time.
- The outlooks are the result of the expert judgment of NIWA’s climate scientists. They take into account observations of atmospheric and ocean conditions and output from global and local climate models. The presence of El Niño or La Niña conditions and the sea surface temperatures around New Zealand can be a useful indicator of likely overall climate conditions for a season.
-
The outlooks state the probability for above average conditions, near average conditions, and below average conditions for rainfall, temperature, soil moisture, and river flows. For example, for winter (June–July–August) 2007, for all the North Island, we assigned the following probabilities for temperature:
· Above average: 60 per cent
· Near average: 30 per cent
· Below average: 10 per cent
We therefore concluded that above average temperatures were very likely.
- This three-way probability means that a random choice would be correct only 33 per cent (or one-third) of the time. It would be like randomly throwing a dart at a board divided into three equal parts, or throwing a dice with three numbers on it. An analogy with coin tossing (a two-way probability) is not correct.
- A 50 per cent ‘hit rate’ is substantially better than guesswork, and comparable with the skill level of the best overseas climate outlooks. See, for example, analysis of global outlooks issued by the International Research Institute for Climate and Society based in the US published in the Bulletin of the American Meteorological Society (Goddard, L., A. G. Barnston, and S. J. Mason, 2003: Evaluation of the IRI’s “net assessment” seasonal climate forecasts 1997–2001. Bull. Amer. Meteor. Soc., 84, 1761–1781).
- Each month, NIWA publishes an analysis of how well its outlooks perform. This is sent to about 3500 recipients of NIWA’s newsletters, including many farmers.
- All outlooks are for the three months as a whole. There will inevitably be wet and dry days, and hot and cold days, within a season. The exact range in temperature and rainfall within each of the three categories varies with location and season. However, as a guide, the “near average” or middle category for the temperature predictions includes deviations up to ±0.5°C for the long-term mean, whereas for rainfall the “near normal” category lies between approximately 80 per cent and 115 per cent of the long-term mean.
- The seasonal climate outlooks are an output of a scientific research programme, supplemented by NIWA’s Capability Funding. NIWA does not have a government contract to produce these outlooks.
- Where probabilities are within 5% of one another, the term “about equally” is used.