Outlook Summary
- ENSO-neutral conditions persisted in April however seas continue to warm across the equatorial Pacific consistent with a developing El Niño. El Niño conditions may arrive during winter.
- During May, variable weather patterns are expected for New Zealand. This will result in mixed air flows, with a tendency toward more frequent southerly flows at the onset of winter that are consistent with a developing El Niño.
- During the beginning of May, a northerly-quarter airflow is expected to bring tropical moisture and very warm temperatures toward New Zealand via an atmospheric river (AR), resulting in widespread, heavy rainfall and increased risk of flooding. More than a month’s worth of rain is expected for parts of the country.
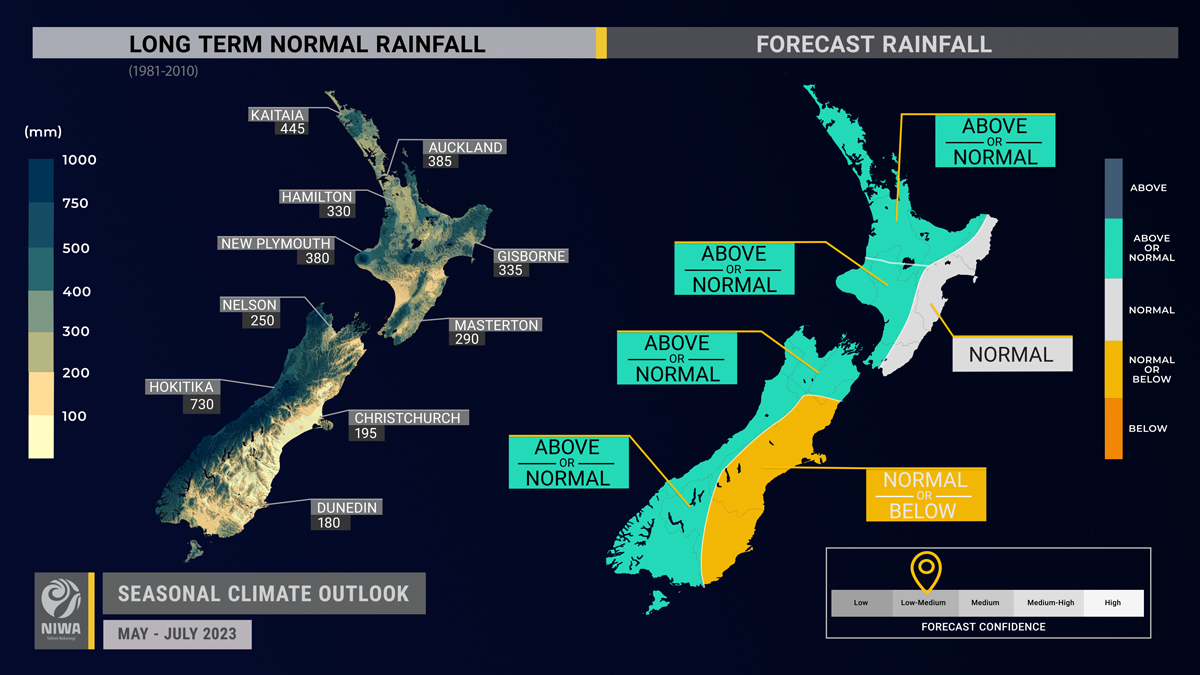
- For the coming three-month period, rainfall is most likely to be normal or above normal in the north and west of the North Island and the north and west of the South Island, while normal rainfall is the most likely in the east of the North Island, and below normal or near normal is most likely in the east of the South Island.
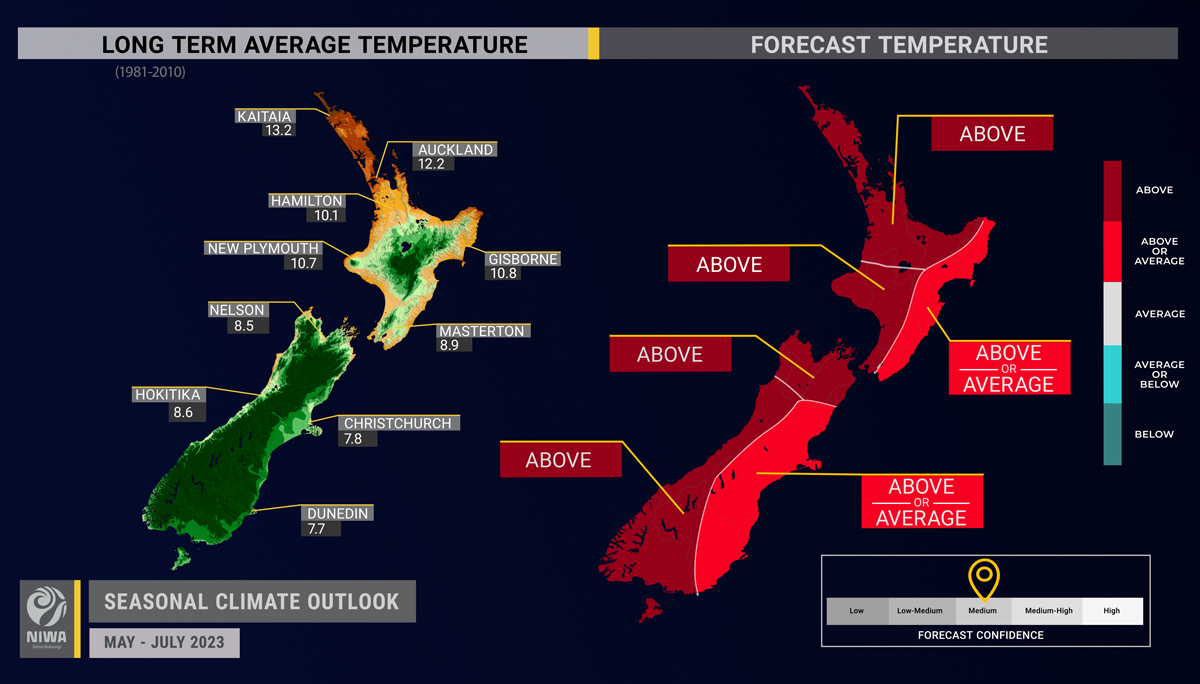
- Seasonal temperatures are most likely to be above average for the north and west of the North Island and the north and west of the South Island, while above average or near average temperatures are about equally likely in the east of the North Island and the east of the South Island.
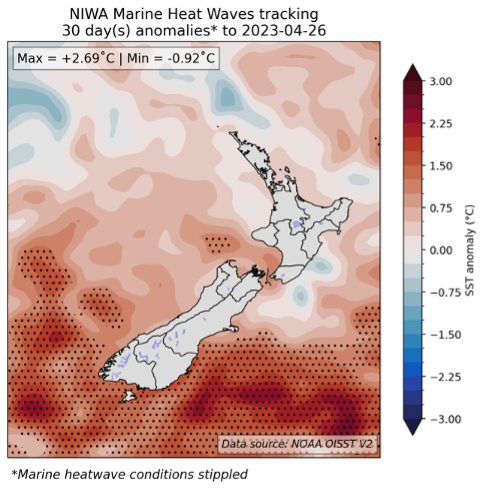
- Coastal sea surface temperatures (SSTs) ranged from 0.20˚C to 1.08˚C above average during April. Coastal SSTs cooled during April, in some cases by as much as 0.95˚C when compared to March.
- Soil moisture levels and river flows are most likely to be near normal in the east of the South Island and the east of the North Island, about equally likely to be near normal or below normal in the north and west of the North Island and west and north of the South Island.
Regional predictions for May – July 2023
Northland, Auckland, Waikato, Bay of Plenty
The table below shows the probabilities (or percent chances) for each of three categories: above average, near average, and below average. In the absence of any forecast guidance there would be an equal likelihood (33% chance) of the outcome being in any one of the three categories. Forecast information from local and global guidance models is used to indicate the deviation from equal chance that is expected for the coming three-month period. The following outcomes are the most likely for this region:
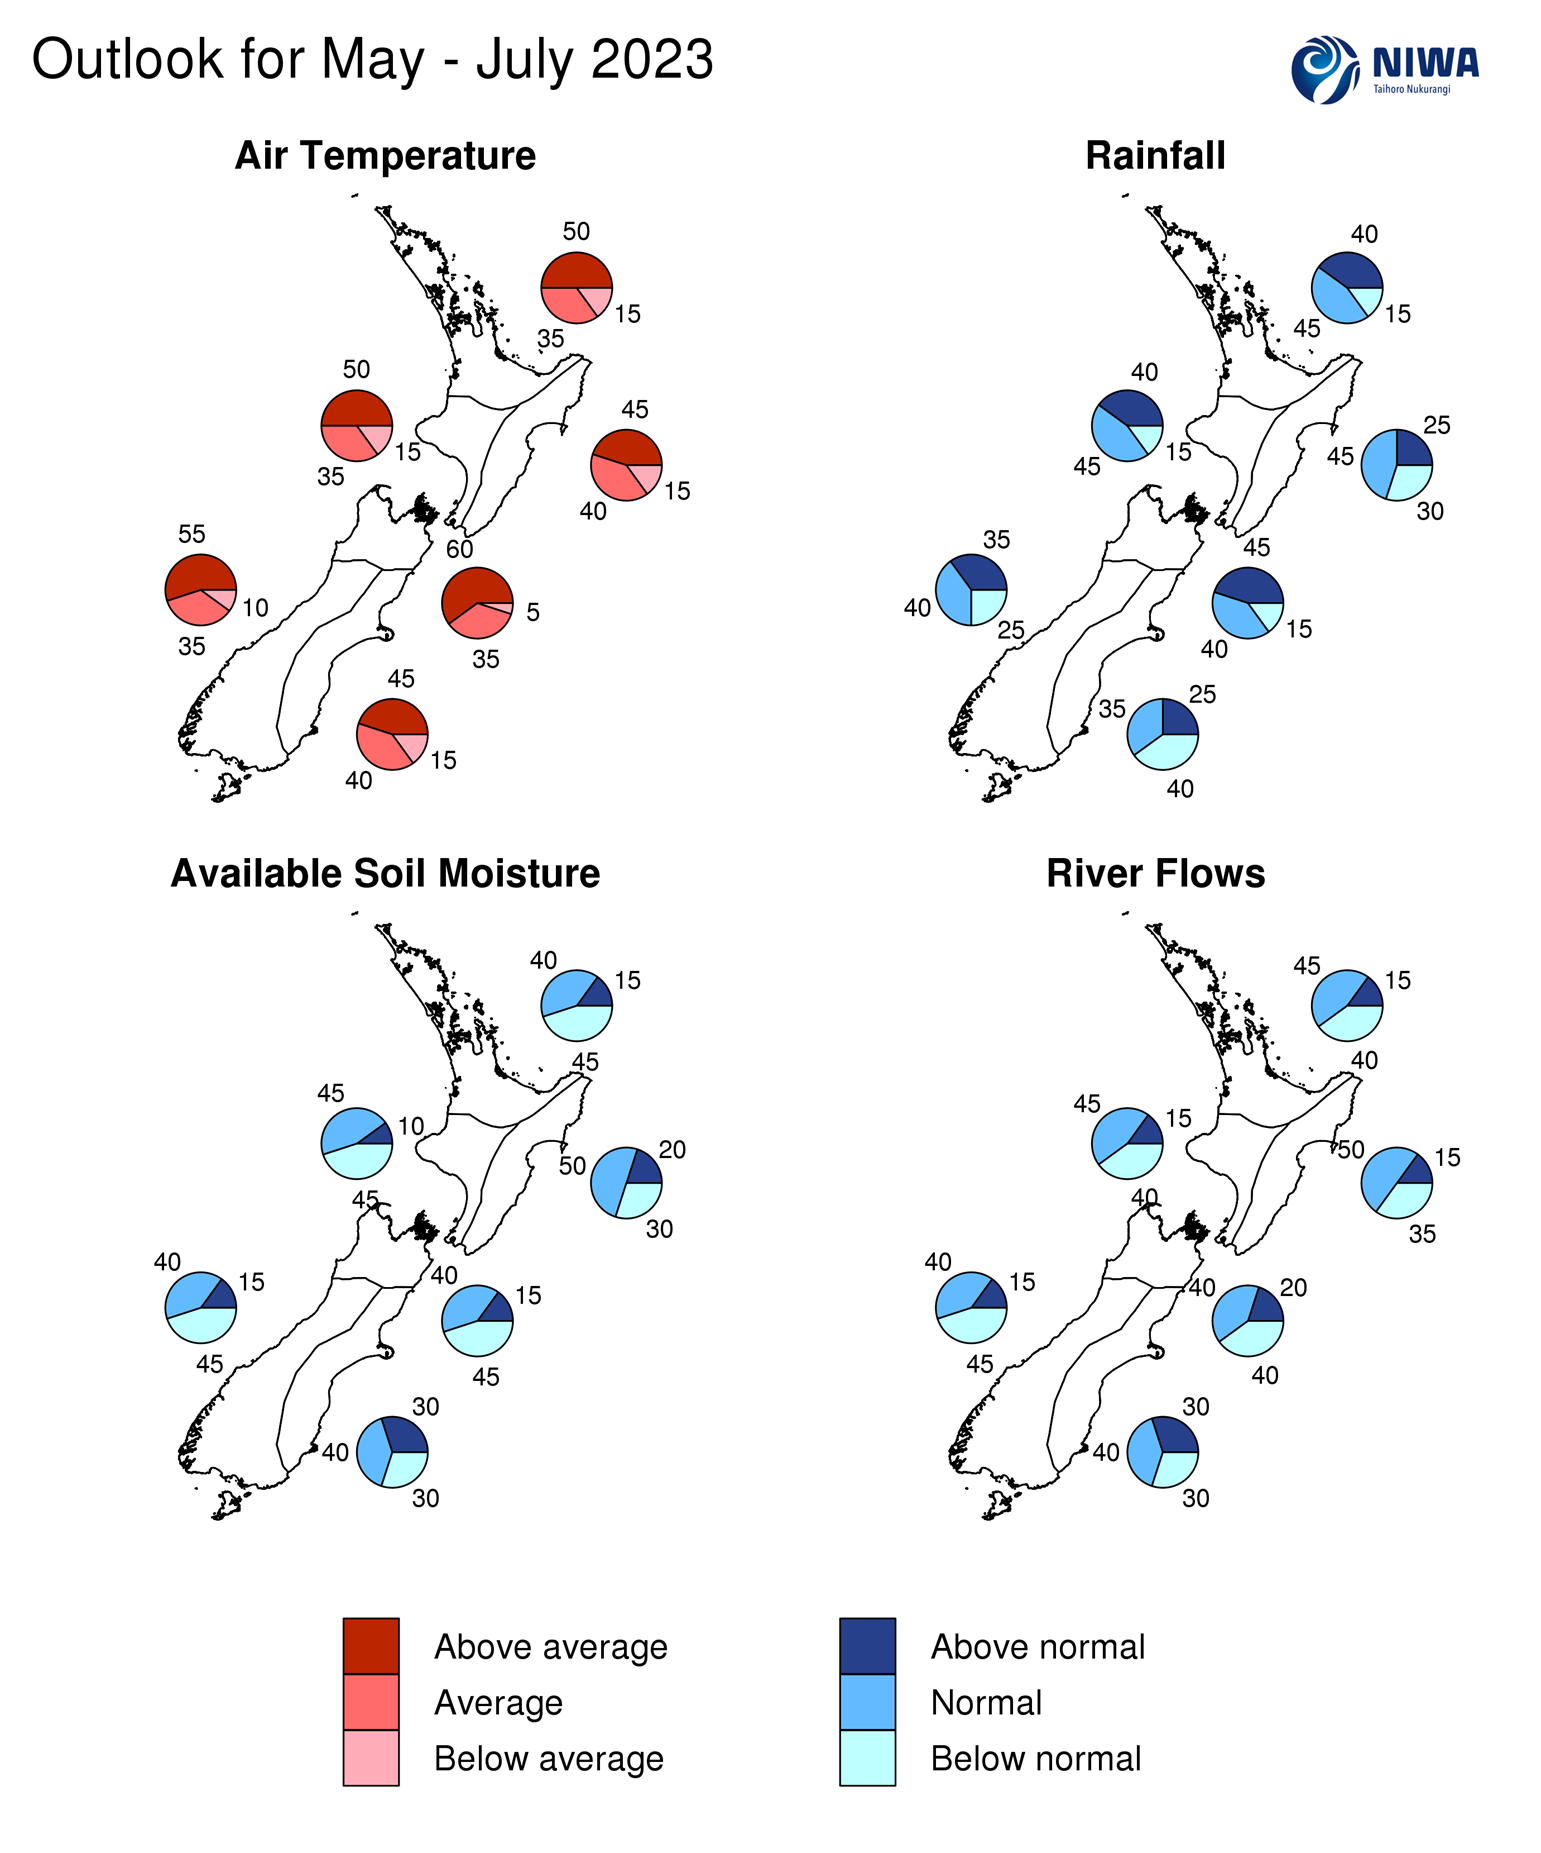
- Temperatures are most likely to be above average (50% chance).
- Rainfall totals are about equally likely to be near normal (45% chance) or above normal (40% chance). A period of northerly winds in early May could to deliver heavy rainfall and possible flooding to this region. Rainfall may then tend lower than normal from early winter as southerly winds become more common.
- Soil moisture levels and river flows are about equally likely to be near normal (40-45% chance) or below normal (40-45% chance).
|
Temperature |
Rainfall |
Soil moisture |
River flows |
|
|
Above average |
50 |
40 |
15 |
15 |
|
Near average |
35 |
45 |
40 |
45 |
|
Below average |
15 |
15 |
45 |
40 |
Central North Island, Taranaki, Whanganui, Manawatu, Wellington
Probabilities are assigned in three categories: above average, near average, and below average.
- Temperatures are most likely to be above average (50% chance).
- Rainfall totals are about equally likely to be near normal (45% chance) or above normal (40% chance). A period of northerly winds in early May could to deliver heavy rainfall and possible flooding to this region.
- Soil moisture levels and river flows are about equally likely to be near normal (45% chance) or below normal (40-45% chance).
|
Temperature |
Rainfall |
Soil moisture |
River flows |
|
|
Above average |
50 |
40 |
10 |
15 |
|
Near average |
35 |
45 |
45 |
45 |
|
Below average |
15 |
15 |
45 |
40 |
Gisborne, Hawke’s Bay, Wairarapa
Probabilities are assigned in three categories: above average, near average, and below average.
- Temperatures are about equally likely to be above average (45% chance) or near average (40% chance).
- Rainfall totals are most likely to be near normal (45% chance). A period of northerly winds in early May could to deliver heavy rainfall and possible flooding to this region.
- Soil moisture levels and river flows are most likely to be near normal (50% chance).
|
Temperature |
Rainfall |
Soil moisture |
River flows |
|
|
Above average |
45 |
25 |
20 |
15 |
|
Near average |
40 |
45 |
50 |
50 |
|
Below average |
15 |
30 |
30 |
35 |
Tasman, Nelson, Marlborough, Buller
Probabilities are assigned in three categories: above average, near average, and below average.
- Temperatures are very likely to be above average (60% chance).
- Rainfall totals are about equally to be above normal (45% chance) or near normal (40% chance). A period of northerly winds in early May could to deliver heavy rainfall and possible flooding to this region. Rainfall may tend lower than normal from early winter as southerly winds become more common.
- Soil moisture levels and river flows are most likely to be near normal (40% chance) or below normal (40-45% chance).
|
Temperature |
Rainfall |
Soil moisture |
River flows |
|
|
Above average |
60 |
45 |
15 |
20 |
|
Near average |
35 |
40 |
40 |
40 |
|
Below average |
05 |
15 |
45 |
40 |
West Coast, Southern Alps and foothills, inland Otago, Southland
Probabilities are assigned in three categories: above average, near average, and below average.
- Temperatures are most likely to be above average (55% chance).
- Rainfall totals are about equally likely to be normal (40% chance) or above normal (35% chance). A period of northerly winds in early May looks to deliver heavy rainfall to northern parts of this region, with large parts of Otago and Southland likely missing the heaviest of the rain.
- Soil moisture levels and river flows are about equally likely to be near normal (40% chance) or below normal (45% chance).
|
Temperature |
Rainfall |
Soil moisture |
River flows |
|
|
Above average |
55 |
35 |
15 |
15 |
|
Near average |
35 |
40 |
40 |
40 |
|
Below average |
10 |
25 |
45 |
45 |
Coastal Canterbury and the nearby plains, east Otago
Probabilities are assigned in three categories: above average, near average, and below average.
- Temperatures are about equally likely to be above average (45% chance) or near average (40% chance).
- Rainfall totals are about equally likely to be below normal (40% chance) or near normal (35% chance).
- Soil moisture levels and river flows are most likely to be near normal (40% chance).
The full probability breakdown is:
|
Temperature |
Rainfall |
Soil moisture |
River flows |
|
|
Above average |
45 |
25 |
30 |
30 |
|
Near average |
40 |
35 |
40 |
40 |
|
Below average |
15 |
40 |
30 |
30 |
Graphical representation of the regional probabilities
Background
The NINO3.4 Index anomaly (which covers the west-central equatorial Pacific) over the last month (through 29 March) was +0.14˚C (climatology: 1991-2020), in the ENSO-neutral range for the second consecutive month. The NINO 1+2 Index (in the eastern Pacific) continued its sharp warming trend, with the 30-day value reaching 2.53˚C above average, warming over a degree in the last month. This is the highest monthly value since July 2015, which occurred before the onset of the most recent El Niño (2015 to 2016 moderate-to-strong El Niño). Sea surface temperatures (SSTs) in the eastern and central equatorial Pacific also continued their warming trends in April, with the NINO3.4 index reaching its highest value since May 2020.
The March monthly Southern Oscillation Index (SOI) was neutral (0.0) and +0.3 from February-April (climatology: 1991-2020), remaining in the neutral range for the second consecutive month.
Trade winds once again relaxed during mid-to-late April, particularly in eastern parts of the equatorial Pacific, owing to a pulse of the Madden-Julian Oscillation (MJO). The result was continued warming of SSTs and higher than average sea surface heights in the east of the basin.
In the subsurface equatorial Pacific, warming continued to occur in April. Some areas warmed by as much as 2˚C, while subsurface temperatures in the east of the basin are now over 4˚C above average. This was due to the continued eastward progression of a downwelling Kelvin wave, coupled with a strengthening of the coastal El Niño near Peru. Downwelling Kelvin waves draw warmer waters from near the sea surface to deeper areas, resulting in subsurface warming.
Meanwhile, the Western Pacific Warm Pool (WPWP) continues to exhibit temperature anomalies of 3˚C or more above average. A pulse of the MJO during May could act to generate another downwelling Kelvin wave, shifting this anomalously warm water to the east and further enhancing the subsurface warmth. This will act to sustain the current warming trend that is already being observed across the equatorial Pacific.
NIWA’s analysis indicates that El Niño has a 70-80% chance of developing during winter and continuing through spring. Meanwhile, ENSO-neutral conditions have a 30% chance of continuing through July. The changes observed to the equatorial Pacific during April, as described above, support a continued progression toward El Niño thresholds. Because anomalous warmth is building in the surface and subsurface of the equatorial Pacific Ocean, there is a reduction of trade winds across the basin, and there is an expectation for these conditions to continue. Therefore, NIWA remains in “El Niño Watch” status.
During April, convective forcing was dominated by the MJO. A strong pulse of the MJO moved across the western and central Pacific at the beginning of the month, generating a series of low pressure systems that were associated with tornado outbreaks in the upper South Island and parts of the North Island. Convection was also favoured in the eastern equatorial Pacific where the coastal El Niño is occurring near Peru.
At the end of April, another MJO pulse was building the western Indian Ocean. This pulse of the MJO is forecast to move over the Maritime Continent and western Pacific by early-to-mid-May. It may linger in this region (much like the last one), generating rising air over the Maritime Continent and sinking air across South America and Africa. This will temporarily bring a return to La Niña-like conditions for New Zealand, as historically phases 4-7 favour northerly or northeasterly winds and wetter conditions, particularly for the North Island. Dynamical forecast guidance (i.e. weather modelling) is aligned with this historical analogue.
An atmospheric Kelvin wave may then race ahead of the main MJO pulse, reaching the eastern Pacific basin by mid-May, while the main MJO pulse is expected to continue to slowly progress eastwards over the Pacific as it lingers over warmer waters. This pulse is expected to reach the eastern edge of the basin by late May or early June, generating sinking air over the Maritime Continent and rising air over the eastern Pacific, South America, and western Africa. The MJO in phases 8 through to 2 is historically associated with southerly-quadrant winds and drier conditions during this time of year. This configuration is more reflective of an atmosphere with El Niño-like characteristics. During these periods of El Niño-like intraseasonal variability, southerlies and westerlies across the country would be favoured.
On average over the coming season, anomalous convection looks to be favoured near the dateline and eastern Pacific, indicative of an atmospheric response to oceanic El Niño. Anomalously suppressed convection looks to favour the Maritime Continent and the eastern Indian Ocean, the former being a canonical signal of El Niño conditions, with the latter being a signal for the possibility of a positive Indian Ocean Dipole (IOD) event later in winter. The IOD is a sea surface temperature seesaw in the Indian Ocean. Positive IOD events are associated with drier-than-normal conditions for parts of New Zealand, particularly if they become superimposed with an El Niño base state.
The atmospheric configuration is very different to the same time last year. Last May, La Niña conditions were present and there were signs of a negative IOD developing. This year, El Niño conditions are expected to develop over the next few months with indications that a positive IOD could also become established later in winter. The result of those two modes of variability working in tandem will be a much different season compared to this time last year. Although May is expected to have periods of heavy rainfall due to atmospheric rivers (AR), June and July are on track to see a reduction in the amount of tropical and subtropical moisture available to passing weather systems, and therefore overall drier conditions are expected.
The Southern Annular Mode (SAM) was negative for April. A positive SAM is signalled in early May with low pressure in the Tasman Sea and Coral Sea. During the season ahead, ENSO-neutral conditions that transition toward El Niño may influence a SAM that is more frequently negative.
New Zealand’s coastal water temperatures cooled from their record-March highs during April. For the west and east of the South Island, SSTs were as much as 0.9˚C cooler by the end of April compared to March. However, they still remained above average during April for the west of the North Island and around the South Island, with the most significant anomalies observed near the western and eastern South Island. SSTs have now trended to near average for the Northern North Island and eastern North Island. While SSTs may linger at warmer-than-normal levels during May owing to northerly-quarter airflows, as more southerly airflows develop toward the onset of winter SSTs are expected to cool over the coming months. Above average SSTs may prevent long-lasting below average air temperatures. For more information, see the NIWA Sea Surface Temperature Update.
NZ 30-day coastal SST anomalies(to 26 April)
|
North NI |
+0.23˚C |
|
West NI |
+0.68˚C |
|
East NI |
+0.20˚C |
|
North SI |
+0.67˚C |
|
West SI |
+1.08˚C |
|
East SI |
+1.01˚C |
Forecast Confidence
Temperature
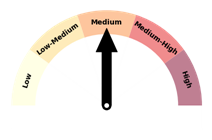
|
Forecast confidence for temperatures is medium. May looks to be a warm month owing to northerly-quarter flows and high humidity, but should El Niño arrive in winter, it could result in cooler temperatures for some areas. |
Rainfall
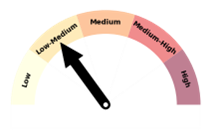
|
Forecast confidence for rainfall is low-to-medium. New Zealand’s climate will be driven by intra-seasonal variability during May, but El Niño could start to drive conditions during winter. This will lead to mixed wind flows and more changeable weather patterns in May, tending more typical of El Niño conditions (south westerly) during winter. The net effect is less certainty in the rainfall outlook. |