Overview
The tropical Pacific overall remained in an ENSO (El Niño – Southern Oscillation) neutral state (neither El Niño nor La Niña) during April 2017.
The strong ‘coastal El Niño’ which developed along the coast of South America (southern Ecuador and northern Peru) during February and March has now weakened. In the central equatorial Pacific Ocean, sea surface temperatures (SSTs) are close to or slightly above normal. Atmospheric patterns generally reflect ENSO-neutral conditions, but convective and rainfall anomalies in the central and western Pacific are still leaning towards weak La Niña-like conditions. Ocean subsurface waters are slightly warmer than normal at depth in the western Pacific and close to the surface in the eastern Pacific, and are generally consistent with an ENSO-neutral state. The Southern Oscillation Index (SOI) is currently negative with an estimated value of -0.4 for April 2017; i.e. on the El Niño side of neutral.
International guidance indicates that a transition towards El Niño conditions over the next three months period (May – July 2017) is more likely than not, with 56% chance, versus 44% chance for persistence of the current ENSO-neutral state. The models indicate increasing chance for El Niño becoming established later during the winter, with nearly 70% chance for the August to October period. Note however that ENSO forecasts made just before the start of the winter season have lower accuracy than at other times of the year, and the current spread between the models’ forecasts is significant.
For May – July 2017 as a whole, the atmospheric circulation around New Zealand is forecast to favour slightly more southwesterly flows than normal, but variable circulation regimes are to be expected over the course of the season.
Climate Scientist Nava Fadaeff explains the seasonal climate outlook for May-July 2017.
Outlook Summary
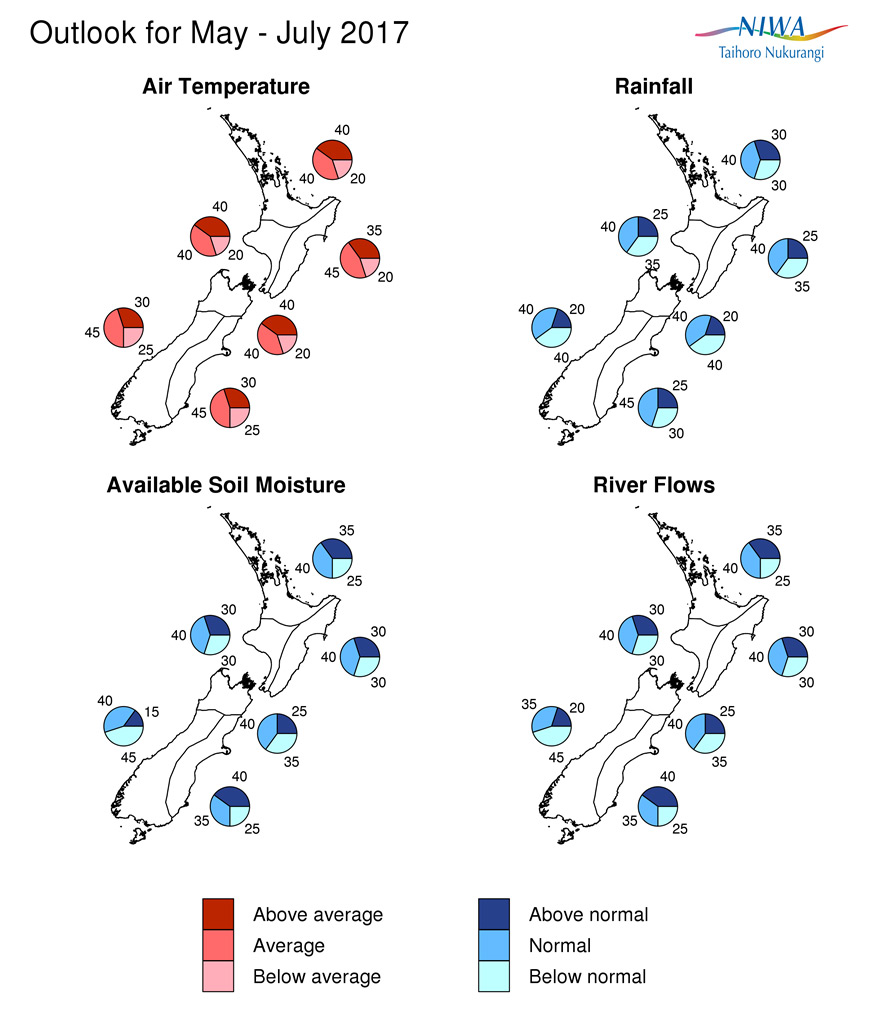
May – July 2017 temperatures are equally likely to be above average (40% chance) or near average (40% chance) for the north and west of the North Island and the north of the South Island and most likely to be near average (45% chance) for the remaining regions of New Zealand. As we transition towards winter, frosts and cold snaps will occur from time to time in cooler locations, even in regions where elevated chance for higher than normal seasonal temperatures is forecast. In fact, the first half of May is expected to experience cold outbreaks, with below or well below normal temperatures for the time of year – this will be in stark contrast to what was observed during April.
May – July 2017 rainfall totals are most likely to be near normal (40-45% chance) in the north of the North Island and east of the South Island. Seasonal rainfall totals are about equally likely to be below normal (35-40% chance) or near normal (40% chance) for the west and east of the North Island and the north and west of the South Island.
May – July 2017 soil moisture levels and river flows are about equally likely to be near normal (35-40% chance) or above normal (35-40% chance) in the north of the North Island and the east of the South Island. In the west and east of the North Island, soil moisture levels and river flows are most likely to be in the near normal range (40% chance). Soil moisture levels and river flows are about equally likely to be near normal (40% chance) or below normal (35% chance) in the north of the South Island. In the west of the South Island, soil moisture levels are about equally likely to be below normal (45% chance) or near normal (40% chance) and river flows most likely to be in the below normal range (45% chance).
Regional predictions for the May – July 2017 season
Northland, Auckland, Waikato, Bay of Plenty
The table below shows the probabilities (or percent chances) for each of three categories: above average, near average, and below average. In the absence of any forecast guidance there would be an equal likelihood (33% chance) of the outcome being in any one of the three categories. Forecast information from local and global guidance models is used to indicate the deviation from equal chance expected for the coming three month period, with the following outcomes the most likely (but not certain) for this region:
- Temperatures are equally likely to be near average (40% chance) or above average (40% chance).
- Rainfall totals are most likely to be in the near normal range (40% chance).
- Soil moisture levels and river flows are about equally likely to be near normal (40% chance) or above normal (35% chance).
The full probability breakdown is:
|
Temperature |
Rainfall |
Soil moisture |
River flows |
|
|
Above average |
40 |
30 |
35 |
35 |
|
Near average |
40 |
40 |
40 |
40 |
|
Below average |
20 |
30 |
25 |
25 |
Central North Island, Taranaki, Whanganui, Manawatu, Wellington
Probabilities are assigned in three categories: above average, near average, and below average.
- Temperatures are equally likely to be near average (40% chance) or above average (40% chance).
- Rainfall totals are about equally likely to be near normal (40% chance) or below normal (35% chance).
- Soil moisture levels and river flows are most likely to be in the near normal range (40% chance).
The full probability breakdown is:
|
Temperature |
Rainfall |
Soil moisture |
River flows |
|
|
Above average |
40 |
25 |
30 |
30 |
|
Near average |
40 |
40 |
40 |
40 |
|
Below average |
20 |
35 |
30 |
30 |
Gisborne, Hawke’s Bay, Wairarapa
Probabilities are assigned in three categories: above average, near average, and below average.
- Temperatures are most likely to be near average (45% chance).
- Rainfall totals are about equally likely to be near normal (40% chance) or below normal (35% chance).
- Soil moisture levels and river flows are most likely to be in the near normal range (40% chance).
The full probability breakdown is:
|
Temperature |
Rainfall |
Soil moisture |
River flows |
|
|
Above average |
35 |
25 |
30 |
30 |
|
Near average |
45 |
40 |
40 |
40 |
|
Below average |
20 |
35 |
30 |
30 |
Tasman, Nelson, Marlborough, Buller
Probabilities are assigned in three categories: above average, near average, and below average.
- Temperatures are equally likely to be near average (40% chance) or above average (40% chance).
- Rainfall totals are equally likely to be near normal (40% chance) or below normal (40% chance).
- Soil moisture levels and river flows are about equally likely to be near normal (40% chance) or below normal (35% chance).
The full probability breakdown is:
|
Temperature |
Rainfall |
Soil moisture |
River flows |
|
|
Above average |
40 |
20 |
25 |
25 |
|
Near average |
40 |
40 |
40 |
40 |
|
Below average |
20 |
40 |
35 |
35 |
West Coast, Alps and foothills, inland Otago, Southland
Probabilities are assigned in three categories: above average, near average, and below average.
- Temperatures are most likely to be near average (45% chance).
- Rainfall totals are equally likely to be in the near normal (40% chance) or below normal (40% chance) range.
- Soil moisture levels are about equally likely to be below normal (45% chance) or near normal (40% chance)
- River flows are most likely to be in the below normal range (45% chance).
The full probability breakdown is:
|
Temperature |
Rainfall |
Soil moisture |
River flows |
|
|
Above average |
30 |
20 |
15 |
20 |
|
Near average |
45 |
40 |
40 |
35 |
|
Below average |
25 |
40 |
45 |
45 |
Coastal Canterbury, east Otago
Probabilities are assigned in three categories: above average, near average, and below average.
- Temperatures are most likely to be near average (45% chance).
- Rainfall totals are most likely to be in the near normal range (45% chance).
- Soil moisture levels and river flows are about equally likely to be in the above normal (40% chance) or near normal (35% chance) range.
The full probability breakdown is:
|
Temperature |
Rainfall |
Soil moisture |
River flows |
|
|
Above average |
30 |
25 |
40 |
40 |
|
Near average |
45 |
45 |
35 |
35 |
|
Below average |
25 |
30 |
25 |
25 |
Graphical representation of the regional probabilities
Background
The tropical Pacific remains in El Niño-Southern Oscillation (ENSO) neutral state. Sea surface temperatures (SSTs) are slightly above average in the central and western equatorial Pacific and above average in the eastern Equatorial Pacific. The very strong SST anomalies (> +2oC) that developed along the coast of South America (affecting southern Ecuador and northern Peru) during February and March (a strong ‘Coastal El Niño’) have now weakened.
Subsurface temperature anomalies along the Equator are slightly positive between about 100 to 150m depth in the western Pacific. In the eastern Pacific, a shallow layer of slightly warmer than normal ocean waters is present, while cooler than normal waters are found at depth. Overall, the subsurface ocean anomalies are relatively weak and do not indicate a strong potential for a rapid transition towards El Niño.
The preliminary Southern Oscillation Index (SOI) for the month of April 2017 is negative at -0.4 (on the El Niño side of neutral). Zonal wind anomalies along the Equator are very close to zero and large-scale circulation patterns are generally consistent with an ENSO-neutral state. However, rainfall and convection anomalies have been mixed over the past month and are reminiscent of weak La Niña conditions notably in the western half of the Pacific, with enhanced convection and rainfall affecting parts of the Maritime Continent, and suppressed convection and rainfall just west of the International Dateline.
International guidance indicates that a transition towards El Niño conditions over the next three months period (May – July 2017) is more likely than not, with 56% chance, versus 44% chance for a persistence of the current ENSO-neutral conditions. The models indicate increasing chances for El Niño later during the winter, with nearly 70% chance for the August to October period. Note however that dynamical ENSO forecasts made just before the start of the winter period carry more uncertainty than at other times of the year and there is a significant spread in the current models’ forecasts. Some models are also less confident in predicting a strong El Niño compared to last month.
Ocean waters surrounding New Zealand are currently warmer than average all around the country, with anomalies exceeding +1oC along the west coast of the South Island and close to +1oC along the north and east of the North Island. SSTs remain warmer than average in the southern part of the Tasman Sea and along southeast Australia. The dynamical models’ forecasts for SSTs indicate that this pattern is likely to persist over the next three months period, and waters in the south Tasman Sea are expected to warm further. However, several outbreaks of southerly winds during the start of May might lead to a short-term reduction in sea surface temperature anomalies around New Zealand. For May – July 2017 as a whole, coastal waters around New Zealand are thus forecast to be average or above average.
Contacts
For comment, please contact:
Ben Noll, Meteorologist – Forecasting Services, NIWA National Climate Centre Tel (09) 375 6334, Mobile (027) 405 3052
Dr Brett Mullan, Principal Scientist, NIWA National Climate Centre Tel (04) 386 0508, Mobile (027) 294 1169
Notes to reporters and editors
- NIWA’s outlooks indicate the likelihood of climate conditions being at, above, or below average for the season as a whole. They are not ‘weather forecasts’. It is not possible to forecast precise weather conditions three months ahead of time.
- The outlooks are the result of the expert judgment of NIWA’s climate scientists. They take into account observations of atmospheric and ocean conditions and output from global and local climate models. The presence of El Niño or La Niña conditions and the sea surface temperatures around New Zealand can be a useful indicator of likely overall climate conditions for a season.
- The outlooks state the probability for above average conditions, near average conditions, and below average conditions for rainfall, temperature, soil moisture, and river flows. For example, for winter (June–July–August) 2007, for all the North Island, we assigned the following probabilities for temperature: · Above average: 60 per cent · Near average: 30 per cent · Below average: 10 per cent We therefore concluded that above average temperatures were very likely.
- This three-way probability means that a random choice would be correct only 33 per cent (or one-third) of the time. It would be like randomly throwing a dart at a board divided into three equal parts, or throwing a dice with three numbers on it. An analogy with coin tossing (a two-way probability) is not correct.
- A 50 per cent ‘hit rate’ is substantially better than guesswork, and comparable with the skill level of the best overseas climate outlooks. See, for example, analysis of global outlooks issued by the International Research Institute for Climate and Society based in the US published in the Bulletin of the American Meteorological Society (Goddard, L., A. G. Barnston, and S. J. Mason, 2003: Evaluation of the IRI’s “net assessment” seasonal climate forecasts 1997–2001. Bull. Amer. Meteor. Soc., 84, 1761–1781).
- Each month, NIWA publishes an analysis of how well its outlooks perform. This is available online and is sent to about 3500 recipients of NIWA’s newsletters, including many farmers. See www.niwa.co.nz/our-science/climate/publications/all/cu
- All outlooks are for the three months as a whole. There will inevitably be wet and dry days, and hot and cold days, within a season. The exact range in temperature and rainfall within each of the three categories varies with location and season. However, as a guide, the “near average” or middle category for the temperature predictions includes deviations up to ±0.5°C for the long-term mean, whereas for rainfall the “near normal” category lies between approximately 80 per cent and 115 per cent of the long-term mean.
- The seasonal climate outlooks are an output of a scientific research programme, supplemented by NIWA’s Capability Funding. NIWA does not have a government contract to produce these outlooks.
- Where probabilities are within 5% of one another, the term “about equally” is used.