Outlook Summary
- ENSO-neutral conditions continued during February 2020. The Southern Oscillation Index (SOI) was within the neutral range (-0.2) while sea surface temperatures (SSTs) in the central Pacific were also in the neutral range.
- Oceanic ENSO-neutral conditions will most likely persist (70% chance) over the next three months.
- Warmer than average ocean waters in the Coral Sea and west-central Pacific Ocean are expected to have an influence on New Zealand’s climate during March-May.
- When the climate drivers described above are active, northerly quarter air flows could bring an increase in humidity, moisture, and rainfall to New Zealand; one such period could occur during March.
- New Zealand’s air temperatures are expected to be pushed in a warmer direction by above average sea surface temperatures near the North Island and in the Tasman Sea over the upcoming three months.
- March – May 2020 air pressure is forecast to be lower than normal to the northwest of New Zealand and at times near the South Island. This is expected to be associated with mixed westerly and northeasterly quarter air flow anomalies.
- Temperatures are mostly likely to be above average in the North Island and about equally likely to be above average or near average in the South Island.
- Rainfall is expected to be near normal in all regions of New Zealand except for the north and west of the South Island where normal or above normal rainfall is about equally likely.
- The tropical Southwest Pacific will be intermittently active during March and April. Four tropical cyclones (Uesi, Vicky, Wasi, Esther) occurred during February and Uesi passed near New Zealand. Significant rainfall, damaging winds, and coastal damage can occur if an ex-tropical cyclone passes near the country.
Air Temperature
March – May 2020 temperatures are most likely to be above average (50-55% chance) in the North Island and about equally likely to be near average (40-45% chance) or above average (40-45%) in the South Island. Early autumn is expected to have periods of summer-like warmth and humidity, especially in the North Island.

Rainfall
March – May 2020 rainfall is most likely to be near normal (45% chance) in all regions of New Zealand except for the north and west of the South Island where near normal (40% chance) or above normal (35% chance) rainfall is about equally likely. During periodic northeasterly quarter air flow patterns, the country will be exposed to moist and humid conditions from the sub-tropics. This may be associated with heavy rainfall events.

Soil moisture
March – May 2020 soil moisture and river flows are most likely to be below normal in the north of the North Island (50% chance) and east of the South Island (45% chance). Soil moisture and river flows are about equally likely to be near normal or below normal in the west and east of the North Island (35-40% chance). Soil moisture levels are about equally likely to be near normal or below normal in the north of the South Island (35-40% chance) with near normal river flows most likely (40% chance). In the west of the South Island, above normal soil moisture and river flows are most likely (45% chance).
Regional predictions for March – May 2020
Northland, Auckland, Waikato, Bay of Plenty
The table below shows the probabilities (or percent chances) for each of three categories: above average, near average, and below average. In the absence of any forecast guidance there would be an equal likelihood (33% chance) of the outcome being in any one of the three categories. Forecast information from local and global guidance models is used to indicate the deviation from equal chance expected for the coming three-month period, with the following outcomes the most likely (but not certain) for this region:
- Temperatures are most likely to be above average (55% chance).
- Rainfall totals are most likely to be near normal (45% chance).
- Soil moisture levels and river flows are most likely to be below normal (50% chance).
The full probability breakdown is:
|
Temperature |
Rainfall |
Soil moisture |
River flows |
|
|
Above average |
55 |
25 |
20 |
20 |
|
Near average |
35 |
45 |
30 |
30 |
|
Below average |
15 |
30 |
50 |
50 |
Central North Island, Taranaki, Whanganui, Manawatu, Wellington
Probabilities are assigned in three categories: above average, near average, and below average.
- Temperatures are most likely to be above average (50% chance).
- Rainfall totals are most likely to be near normal (45% chance).
- Soil moisture levels and river flows are about equally likely to be near normal (40% chance) or below normal (35% chance).
The full probability breakdown is:
|
Temperature |
Rainfall |
Soil moisture |
River flows |
|
|
Above average |
50 |
35 |
25 |
25 |
|
Near average |
35 |
45 |
40 |
40 |
|
Below average |
15 |
20 |
35 |
35 |
Gisborne, Hawke’s Bay, Wairarapa
Probabilities are assigned in three categories: above average, near average, and below average.
- Temperatures are most likely to be above average (50% chance).
- Rainfall totals are most likely to be near normal (45% chance).
- Soil moisture levels and river flows are about equally likely to be near normal (40% chance) or below normal (35% chance).
The full probability breakdown is:
|
Temperature |
Rainfall |
Soil moisture |
River flows |
|
|
Above average |
50 |
30 |
25 |
25 |
|
Near average |
35 |
45 |
40 |
40 |
|
Below average |
15 |
25 |
35 |
35 |
Tasman, Nelson, Marlborough, Buller
Probabilities are assigned in three categories: above average, near average, and below average.
- Temperatures are about equally likely to be near average (40% chance) or above average (45% chance).
- Rainfall totals are about equally likely to be near normal (40% chance) or above normal (35% chance).
- Soil moisture levels are about equally likely to be near normal (40% chance) or below normal (35%) while river flows are most likely to be near normal (40% chance).
The full probability breakdown is:
|
Temperature |
Rainfall |
Soil moisture |
River flows |
|
|
Above average |
45 |
35 |
25 |
30 |
|
Near average |
40 |
40 |
40 |
40 |
|
Below average |
15 |
25 |
35 |
30 |
West Coast, Alps and foothills, inland Otago, Southland
Probabilities are assigned in three categories: above average, near average, and below average.
- Temperatures are about equally likely to be near average (40% chance) or above average (40% chance).
- Rainfall totals are about equally likely to be near normal (40% chance) or above normal (35% chance).
- Soil moisture levels and river flows are most likely to be above normal (45% chance).
The full probability breakdown is:
|
Temperature |
Rainfall |
Soil moisture |
River flows |
|
|
Above average |
40 |
35 |
45 |
45 |
|
Near average |
40 |
40 |
35 |
35 |
|
Below average |
20 |
25 |
20 |
20 |
Coastal Canterbury, east Otago
Probabilities are assigned in three categories: above average, near average, and below average.
- Temperatures are about equally likely to be near average (45% chance) or above average (40% chance).
- Rainfall totals are most likely to be near normal (45% chance).
- Soil moisture levels and river flows are most likely to be below normal (45% chance).
The full probability breakdown is:
|
Temperature |
Rainfall |
Soil moisture |
River flows |
|
|
Above average |
40 |
30 |
20 |
20 |
|
Near average |
45 |
45 |
35 |
35 |
|
Below average |
15 |
25 |
45 |
45 |
Graphical representation of the regional probabilities

Background
The NINO3.4 Index anomaly (in the central Pacific) for February 2020 (to the 23rd) was +0.30˚C (in the neutral range). The warmest ocean waters with respect to average continued to be located in the west-central Pacific, with the NINO4 region recording a monthly value of +0.80˚C (in the El Niño range).
During February 2020, upper-oceanic heat content remained above average near the International Date Line and increased slightly across the east-central Pacific. The warmest sea surface temperatures (SSTs) (30-32˚C) worldwide were located near the International Date Line and thus anomalous high rainfall and convection is expected there during the upcoming three month period.
Trade winds were weaker than normal near and west of the International Date Line during February, allowing the west-central Pacific warm pool to persist. During March, weaker than normal trade winds are expected to persist in the west-central Pacific while enhanced trade winds are possible in the east-central part of the basin. This should lead to the persistence of the current SST pattern (warmer west, cooler east).
According to the consensus from international models, ENSO-neutral conditions are most likely (70% chance) for the March – May period. For the June – August period, the probability for ENSO-neutral conditions is 57%. ENSO-neutral (39% chance) and El Niño (37%) chance are then about equally likely during September – November.
During February, New Zealand’s coastal water temperatures were near or above average around the North Island and east of the South Island, and near or slightly below average in the north and west of the South Island. All regions experienced an increase compared to January. SSTs also increased across the Tasman and Coral Seas. Warm and humid northerly quarter air flows during March are expected to result in additional ocean warming around New Zealand.
New Zealand Coastal Sea Surface Temperatures during February 2020 (to the 25th):
|
North NI |
West NI |
East NI |
North SI |
West SI |
East SI |
|
0.22˚C |
-0.07˚C |
+0.78˚C |
0.10˚C |
-0.10˚C |
+0.47˚C |
The Southern Annular Mode (SAM) was quite variable during February. The SAM could turn more negative during the second week of March as a trough of low pressure develops in the Tasman Sea which could be associated with an increase in the chance for rain across New Zealand.
The Madden Julian Oscillation (MJO) was active over the western Pacific Ocean and eastern Maritime Continent, or phases 4-6, during February in response to a warm pool of water there. This was associated with the formation of four tropical cyclones in the Southwest Pacific (Uesi, Vicky, Wasi, and Esther). During March, convection is forecast to reemerge over and west of the International Date Line as well as the Maritime Continent. Additional tropical or sub-tropical cyclones are possible in the Coral Sea and tropical Southwest Pacific, which could send moisture toward New Zealand.
Forecast Confidence
Temperature
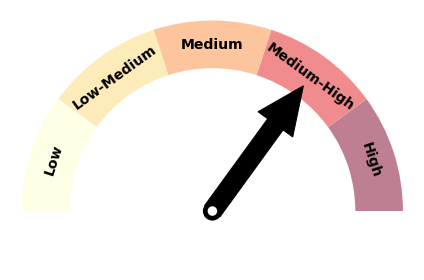
|
Forecast confidence for temperature is medium to high. A very warm and humid start to the autumn season is expected with frequent northerly quarter air flows. Thus, above average coastal sea surface temperatures are expected, which will influence air temperatures upward. A cooler than average autumn appears quite unlikely. |
Rainfall
|
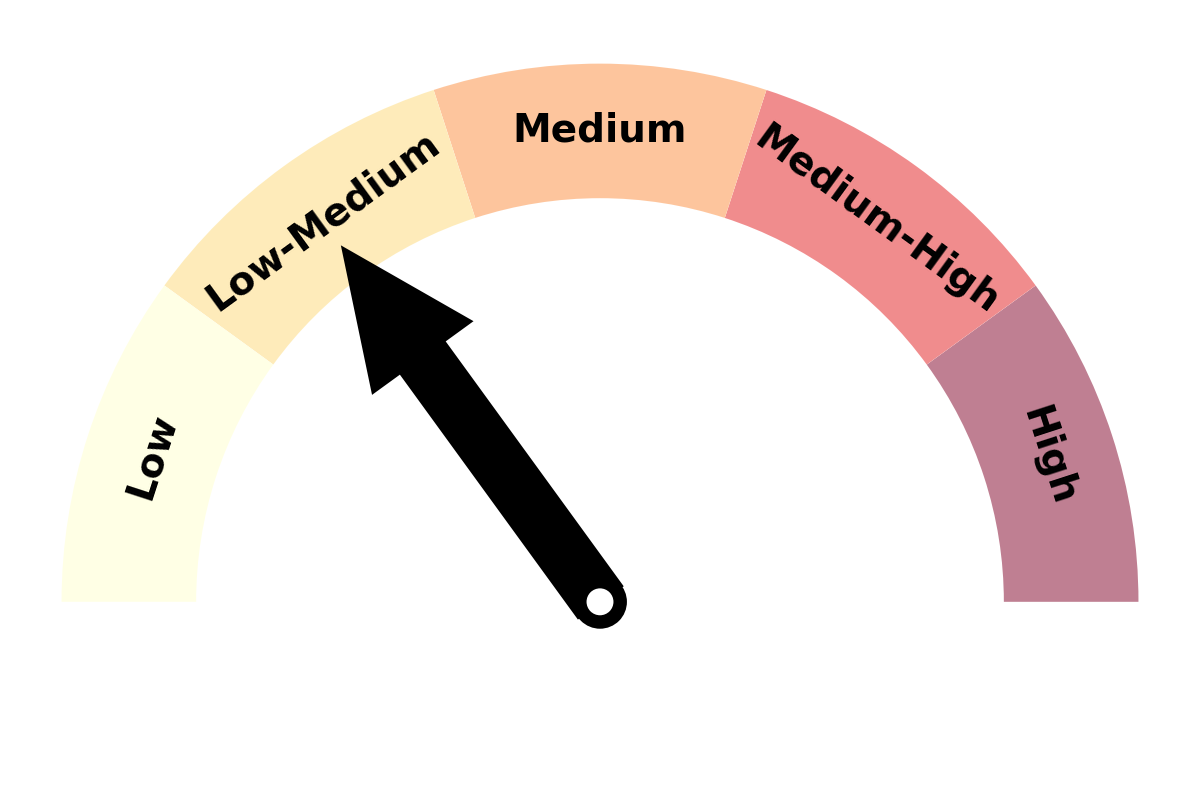
|
Forecast confidence for rainfall is low to medium. The lack of strong climate drivers (ENSO-neutral, variable SAM, unclear tropical influence) makes this a particularly challenging forecast. Many models lean in a wetter direction for autumn, but drier than normal conditions have now persisted for several months in the New Zealand region and there is a concern that this could continue for at least a part of the upcoming season. |