Outlook summary
- A central Pacific El Niño is now occurring as the ocean and atmosphere have been weakly coupled for a third consecutive month. Traditionally, this occurs farther east toward South America and during the early summer season.
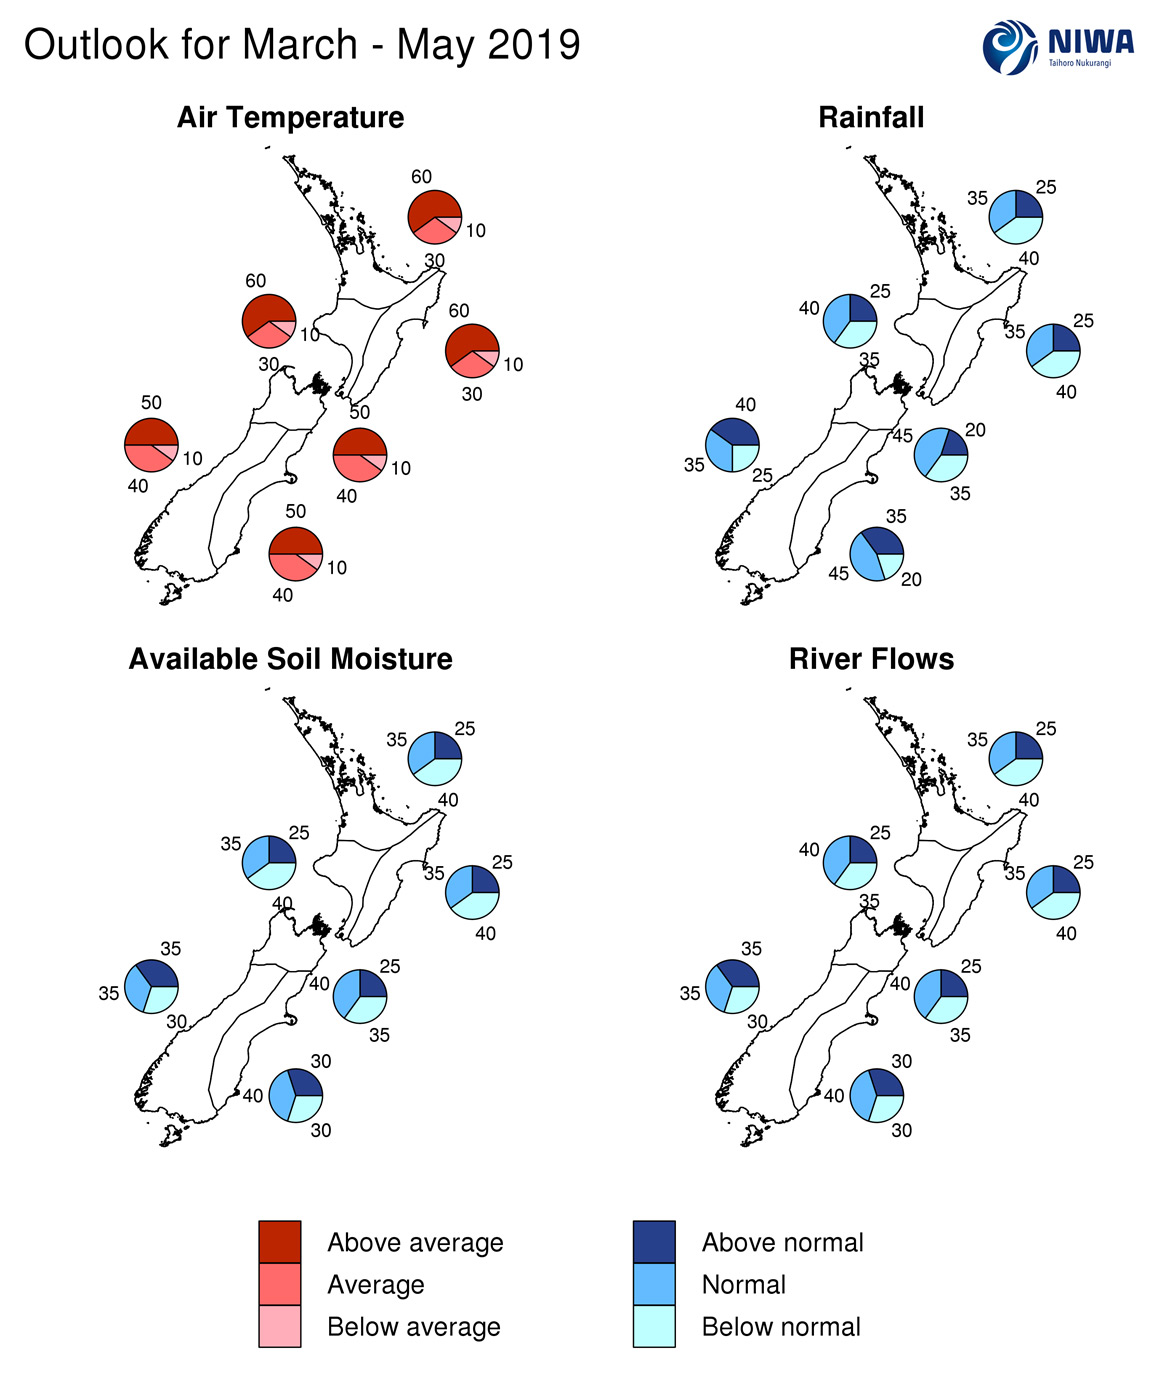
- Mean temperatures are forecast to be above average for all of New Zealand.
- For the autumn season, the regional circulation (flow of air) for New Zealand is likely to be influenced by the tropics to the north and the Tasman Sea to the west. Furthermore, when the tropics become the dominant driver of weather patterns, easterly quarter winds will become more likely. Otherwise, westerly quarter flow anomalies are favoured.
- The continuation of warmer than average sea surface temperatures in the Tasman Sea as well as a central based El Niño may contribute extra warmth, moisture, and increased risk for occasional heavy rainfall events this autumn season, although long dry spells are forecast to begin the season.
- For the current tropical cyclone season (November 2018 to April 2019), NIWA’s Southwest Pacific Tropical Cyclone Outlook indicates that the risk for New Zealand is near normal. On average, at least one ex-tropical cyclone passes within 550 km of New Zealand each year. Significant rainfall, damaging winds, and coastal damage can occur during these events.
March – May 2019 temperatures are forecast to be above average (50-60% chance) for all regions of New Zealand. A particularly warm start is expected for the autumn season, but cold snaps and frosts are likely to occur in colder locations as the season progresses.
March – May 2019 rainfall totals are forecast to be normal or below normal (35-40% chance) for all of the North Island. Normal or above normal rainfall (35-40% chance) is expected for the west of the South Island with near normal rainfall elsewhere (45% chance).
March – May 2019 soil moisture levels and river flows are about equally likely to be below normal or near normal (35-40% chance) for all of the North Island. For the west of South Island, soil moisture and river flows likely to be near the climatological range (i.e. near the long term normal) with near average conditions for the north and east of the island.
Climate scientist Nava Fadaeff and meteorologist/forecaster Ben Noll explain the probabilities for autumn.
Regional predictions for the March – May 2019 season
Northland, Auckland, Waikato, Bay of Plenty
The table below shows the probabilities (or percent chances) for each of three categories: above average, near average, and below average. In the absence of any forecast guidance there would be an equal likelihood (33% chance) of the outcome being in any one of the three categories. Forecast information from local and global guidance models is used to indicate the deviation from equal chance expected for the coming three-month period, with the following outcomes the most likely (but not certain) for this region:
- Temperatures are very likely to be above average (60% chance).
- Rainfall totals are about equally likely to be near normal (35% chance) or below normal (40% chance).
- Soil moisture levels and river flows are about equally likely to be below normal (40% chance) or near normal (35% chance).
The full probability breakdown is:
|
Temperature |
Rainfall |
Soil moisture |
River flows |
|
|
Above average |
60 |
25 |
25 |
25 |
|
Near average |
30 |
35 |
35 |
35 |
|
Below average |
10 |
40 |
40 |
40 |
Central North Island, Taranaki, Whanganui, Manawatu, Wellington
Probabilities are assigned in three categories: above average, near average, and below average.
- Temperatures are very likely to be above average (60% chance).
- Rainfall totals are about equally likely to be near normal (40% chance) or below normal (35% chance).
- Soil moisture levels and river flows are about equally likely to be below normal (40% chance) or near normal (35-40% chance).
The full probability breakdown is:
|
Temperature |
Rainfall |
Soil moisture |
River flows |
|
|
Above average |
60 |
25 |
25 |
25 |
|
Near average |
30 |
35 |
35 |
40 |
|
Below average |
10 |
40 |
40 |
35 |
Gisborne, Hawke’s Bay, Wairarapa
Probabilities are assigned in three categories: above average, near average, and below average.
- Temperatures are very likely to be above average (60% chance).
- Rainfall totals are about equally likely to be near normal (35% chance) or below normal (40% chance).
- Soil moisture levels and river flows are about equally likely to be below normal (40% chance) or near normal (35% chance).
The full probability breakdown is:
|
Temperature |
Rainfall |
Soil moisture |
River flows |
|
|
Above average |
60 |
25 |
25 |
25 |
|
Near average |
30 |
35 |
35 |
35 |
|
Below average |
10 |
40 |
40 |
40 |
Tasman, Nelson, Marlborough, Buller
Probabilities are assigned in three categories: above average, near average, and below average.
- Temperatures are most likely to be above average (50% chance).
- Rainfall totals are most likely to be in the near normal range (45% chance).
- Soil moisture levels and river flows are about equally likely to be near normal (40% chance) or below normal (35% chance)
The full probability breakdown is:
|
Temperature |
Rainfall |
Soil moisture |
River flows |
|
|
Above average |
50 |
20 |
25 |
25 |
|
Near average |
40 |
45 |
40 |
40 |
|
Below average |
10 |
35 |
35 |
35 |
West Coast, Alps and foothills, inland Otago, Southland
Probabilities are assigned in three categories: above average, near average, and below average.
- Temperatures are most likely to be above average (50% chance).
- Rainfall totals are about equally likely to be near normal (35% chance) or above normal (40% chance).
- Soil moisture levels and river flows are likely to be near the climatological range, i.e. near the long term normal (30-35% chance).
The full probability breakdown is:
|
Temperature |
Rainfall |
Soil moisture |
River flows |
|
|
Above average |
50 |
40 |
35 |
35 |
|
Near average |
40 |
35 |
35 |
35 |
|
Below average |
10 |
25 |
30 |
30 |
Coastal Canterbury, east Otago
Probabilities are assigned in three categories: above average, near average, and below average.
- Temperatures are most likely to be above average (50% chance).
- Rainfall totals are most likely to be in the near normal range (45% chance).
- Soil moisture levels and river flows are most likely to be in the near normal range (40% chance).
The full probability breakdown is:
|
Temperature |
Rainfall |
Soil moisture |
River flows |
|
|
Above average |
50 |
35 |
30 |
30 |
|
Near average |
40 |
45 |
40 |
40 |
|
Below average |
10 |
20 |
30 |
30 |
Graphical representation of the regional probabilities
Background
Sea surface temperatures (SSTs) remained above average in the equatorial Pacific Ocean during February 2019, particularly near and just west of the International Dateline.
The NINO3.4 Index anomaly was generally just below +0.5˚C during February (to the 24th), with an average anomaly of +0.47˚C. The NINO4 Index (in the western Pacific: 5oN-5oS, 170oW-120oW) recorded an anomaly of +0.75˚C during February (through the 24th). This distribution of ocean temperature anomalies along the equator is dissimilar to traditional oceanic El Niño conditions, where the NINO3.4 (central Pacific Ocean) SST anomaly is greater than NINO4 (western Pacific Ocean).
The atmosphere continued to respond to a warm pool of water in the central and western tropical Pacific Ocean. This was reflected by well above normal rainfall during February near the Dateline and below normal rainfall over the Maritime Continent (Indonesia and north of Australia). For the third consecutive month, the area of high rainfall was well aligned with the warm pool of water over the western Pacific Ocean, indicating the ocean and atmosphere are weakly coupled.
The Southern Oscillation Index (SOI) decreased substantially from near 0.0 in January to a value of -1.3 in February. Over the past two months, the SOI has decreased markedly from a December value of +0.8. The three-month (December 2018 – February 2019) SOI value is -0.2, now on the El Niño side of neutral. The notable shift over the past two months suggests that the ocean and atmosphere are becoming more connected.
Consequently, a weakly coupled central Pacific El Niño is now present.
The probability for oceanic El Niño conditions, according to the consensus from international models, is 76% for the March – May period, this is an increase from 66% last month. For the winter season, the probabilities have increased to 61%, up from 48% last month. Oceanic El Niño remains the mostly likely outcome for the spring season at 48%. This continues to suggest the potential for a ‘protracted’ event (multi-year duration).
New Zealand’s coastal waters for February 2019 were warmer than average for the North Island and eastern South Island. However, waters have cooled to near or below average for the north and west of the South Island. Marine heatwave conditions are possibly being reached in the east-central Tasman Sea with anomalies of 2.0 to 3.0˚C above average by the last week of the month. For the month as a whole, the anomalies are lower those observed during the marine heatwave of summer 2017-18.
The forecast models are consistent in predicting above to well above average regional ocean temperatures over the next three-month period (March – May 2019), which are expected to have a strong influence on New Zealand’s air temperatures.
The Southern Annular Mode (SAM) began the month positive, however, since week 2 of February the SAM has been negative. The SAM is forecast to trend to neutral to possibly positive levels in early-to-mid March, conducive to higher pressures and reduced rainfall over the country.
Download
Seasonal climate outlook - March - May 2019 [3.6MB PDF]
Contacts
Chris Brandolino, Principal Scientist – Forecasting, NIWA National Climate Centre Tel (09) 375 6335.
Dr Brett Mullan, Principal Scientist, NIWA National Climate Centre Tel (04) 386 0508.
Notes to reporters and editors
- NIWA’s outlooks indicate the likelihood of climate conditions being at, above, or below average for the season as a whole. They are not ‘weather forecasts’. It is not possible to forecast precise weather conditions three months ahead of time.
- The outlooks are the result of the expert judgment of NIWA’s climate scientists. They take into account observations of atmospheric and ocean conditions and output from global and local climate models. The presence of El Niño or La Niña conditions and the sea surface temperatures around New Zealand can be a useful indicator of likely overall climate conditions for a season.
- The outlooks state the probability for above average conditions, near average conditions, and below average conditions for rainfall, temperature, soil moisture, and river flows. For example, for winter (June–July–August) 2007, for all the North Island, we assigned the following probabilities for temperature: · Above average: 60 per cent · Near average: 30 per cent · Below average: 10 per cent We therefore concluded that above average temperatures were very likely.
- This three-way probability means that a random choice would be correct only 33 per cent (or one-third) of the time. It would be like randomly throwing a dart at a board divided into three equal parts, or throwing a dice with three numbers on it. An analogy with coin tossing (a two-way probability) is not correct.
- A 50 per cent ‘hit rate’ is substantially better than guesswork, and comparable with the skill level of the best overseas climate outlooks. See, for example, analysis of global outlooks issued by the International Research Institute for Climate and Society based in the US published in the Bulletin of the American Meteorological Society (Goddard, L., A. G. Barnston, and S. J. Mason, 2003: Evaluation of the IRI’s “net assessment” seasonal climate forecasts 1997–2001. Bull. Amer. Meteor. Soc., 84, 1761–1781).
- Each month, NIWA publishes an online analysis of how well its outlooks perform. The analysis is sent to about 3500 recipients of NIWA’s newsletters, including many farmers.
- All outlooks are for the three months as a whole. There will inevitably be wet and dry days, and hot and cold days, within a season. The exact range in temperature and rainfall within each of the three categories varies with location and season. However, as a guide, the “near average” or middle category for the temperature predictions includes deviations up to ±0.5°C for the long-term mean, whereas for rainfall the “near normal” category lies between approximately 80 per cent and 115 per cent of the long-term mean.
- The seasonal climate outlooks are an output of a scientific research programme, supplemented by NIWA’s Capability Funding. NIWA does not have a government contract to produce these outlooks.
- Where probabilities are within 5% of one another, the term “about equally” is used.