Overview
The tropical Pacific is currently in an ENSO (El Niño – Southern Oscillation) neutral state (neither El Niño nor La Niña).
Sea surface temperatures (SSTs) in the central Equatorial Pacific Ocean are near average. However, during February, warming occurred across parts of the central and eastern equatorial Pacific, with the easternmost part of the equatorial Pacific observing its warmest sea-surface temperature anomalies since December 2015. In the subsurface ocean, warmer than average temperatures (+2.0oC anomalies) are present in the western equatorial Pacific but remain near or slightly below average across the central and eastern equatorial Pacific. The Southern Oscillation Index (SOI) was weakly negative during February 2017. Rainfall has been well below normal across the western equatorial Pacific, but above normal in the eastern equatorial Pacific toward South America, a climatic trait more typical of El Niño conditions.
International guidance favours ENSO-neutral conditions with high probability (85% chance) over the next three month period (March – May 2017). Later during the year, models indicate significant chances for a return to El Niño conditions (over 50% in August – October 2017). As of 28 February, the Australian Bureau of Meteorology (BoM) ENSO tracker has been escalated to the “El Niño Watch” category. This means, according to the BoM, that the likelihood of El Nino forming in 2017 is approximately 50%.
However, over the next three months, with the likely persistence of ENSO-neutral conditions and intermittently active periods in the Madden-Julian Oscillation (pattern of increased or decreased rainfall and cloudiness along the equator that has a typical lifespan of 60 to 120 days) changeability in New Zealand’s weather patterns is likely to occur. The atmospheric circulation around New Zealand is expected to favour more westerly wind flows than normal.
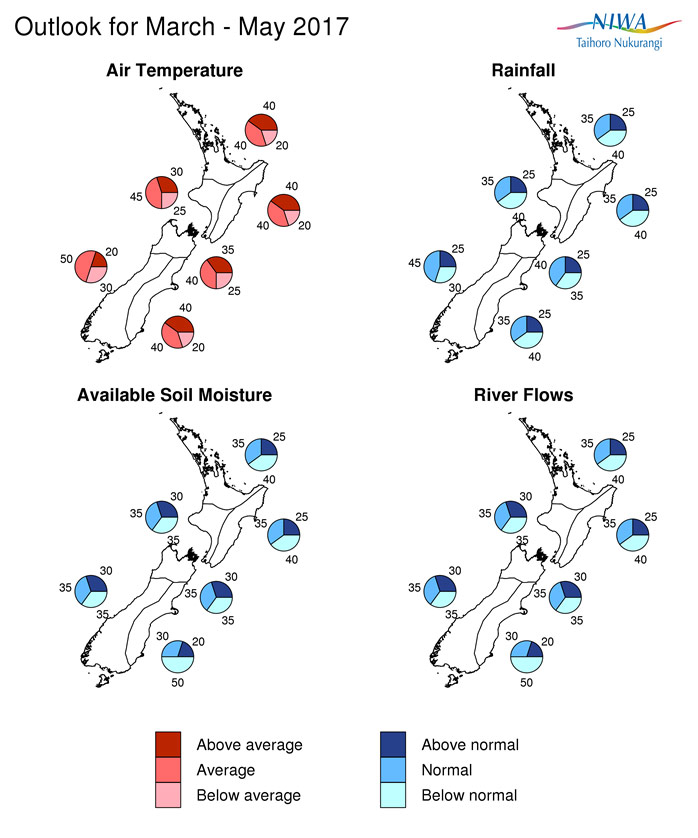
Outlook summary
March – May 2017 temperatures are about equally likely to be average (40-45% chance) or above average (35-40% chance) in the north and east of both the North and South Island. In the west of both Islands, March – May 2017 temperatures are most likely to be near average (45-50% chance). As autumn progresses, frosts may occur from time to time in cooler locations.
March – May 2017 rainfall totals are about equally likely to be near normal (35-40% chance) or below normal (35-40% chance) in all regions of the country except the west of the South Island where near normal rainfall is most likely (45% chance).
March – May 2017 soil moisture levels and river flows are about equally likely to be normal (35% chance) or below normal (35-40% chance) in the North Island. In the South Island, below normal soil moisture levels and river flows are most likely (50% chance) for the east and about equally likely (35% chance) to be normal or below normal in the north and west.
Regional predictions for the March – May 2017 season
Northland, Auckland, Waikato, Bay of Plenty
The table below shows the probabilities (or percent chances) for each of three categories: above average, near average, and below average. In the absence of any forecast guidance there would be an equal likelihood (33% chance) of the outcome being in any one of the three categories. Forecast information from local and global guidance models is used to indicate the deviation from equal chance expected for the coming three month period, with the following outcomes the most likely (but not certain) for this region:
- Temperatures are equally likely to be near average (40% chance) or above average (40% chance).
- Rainfall totals are about equally likely to be in the near normal (35% chance) or below normal range (40% chance).
- Soil moisture levels and river flows are about equally likely to be normal (35% chance) or below normal (40% chance).
The full probability breakdown is:
|
Temperature |
Rainfall |
Soil moisture |
River flows |
|
|
Above average |
40 |
25 |
25 |
25 |
|
Near average |
40 |
35 |
35 |
35 |
|
Below average |
20 |
40 |
40 |
40 |
Central North Island, Taranaki, Whanganui, Manawatu, Wellington
Probabilities are assigned in three categories: above average, near average, and below average.
- Temperatures are most likely to be near average (45% chance).
- Rainfall totals are about equally likely to be in the near normal (35% chance) or below normal range (40% chance).
- Soil moisture levels and river flows are equally likely to be normal (35% chance) or below normal (35% chance).
The full probability breakdown is:
|
Temperature |
Rainfall |
Soil moisture |
River flows |
|
|
Above average |
30 |
25 |
30 |
30 |
|
Near average |
45 |
35 |
35 |
35 |
|
Below average |
25 |
40 |
35 |
35 |
Gisborne, Hawke’s Bay, Wairarapa
Probabilities are assigned in three categories: above average, near average, and below average.
- Temperatures are equally likely to be near average (40% chance) or above average (40% chance).
- Rainfall totals are about equally likely to be in the near normal (35% chance) or below normal range (40% chance).
- Soil moisture levels and river flows are about equally likely to be normal (35% chance) or below normal (40% chance).
The full probability breakdown is:
|
Temperature |
Rainfall |
Soil moisture |
River flows |
|
|
Above average |
40 |
25 |
25 |
25 |
|
Near average |
40 |
35 |
35 |
35 |
|
Below average |
20 |
40 |
40 |
40 |
Tasman, Nelson, Marlborough, Buller
Probabilities are assigned in three categories: above average, near average, and below average.
- Temperatures are about equally likely to be near average (40% chance) or above average (35% chance).
- Rainfall totals are about equally likely to be in the near normal (40% chance) or below normal range (35% chance).
- Soil moisture levels and river flows are equally likely to be normal (35% chance) or below normal (35% chance).
The full probability breakdown is:
|
Temperature |
Rainfall |
Soil moisture |
River flows |
|
|
Above average |
35 |
25 |
30 |
30 |
|
Near average |
40 |
40 |
35 |
35 |
|
Below average |
25 |
35 |
35 |
35 |
West Coast, Alps and foothills, inland Otago, Southland
Probabilities are assigned in three categories: above average, near average, and below average.
- Temperatures are most likely to be near average (50% chance).
- Rainfall totals are most likely to be in the near normal range (45% chance).
- Soil moisture levels and river flows are equally likely to be normal (35% chance) or below normal (35% chance).
The full probability breakdown is:
|
Temperature |
Rainfall |
Soil moisture |
River flows |
|
|
Above average |
20 |
25 |
30 |
30 |
|
Near average |
50 |
45 |
35 |
35 |
|
Below average |
30 |
30 |
35 |
35 |
Coastal Canterbury, east Otago
Probabilities are assigned in three categories: above average, near average, and below average.
- Temperatures are equally likely to be near average (40% chance) or above average (40% chance).
- Rainfall totals are about equally likely to be in the near normal (35% chance) or below normal range (40% chance).
- Soil moisture levels and river flows are most likely to be below normal (50% chance).
The full probability breakdown is:
|
Temperature |
Rainfall |
Soil moisture |
River flows |
|
|
Above average |
40 |
25 |
20 |
20 |
|
Near average |
40 |
35 |
30 |
30 |
|
Below average |
20 |
40 |
50 |
50 |
Graphical representation of the regional probabilities
Background
The tropical Pacific is currently in an ENSO (El Niño – Southern Oscillation) neutral state. Sea surface temperatures (SSTs) in the central equatorial Pacific Ocean remain near or slightly below average, with a value of -0.1oC in the NINO3.4 region (central Pacific) for the month of February. However, during February, warming occurred across the central and eastern equatorial Pacific, with the NINO3.4 region observing its first positive weekly anomaly since June 2016. In the NINO1+2 region (extreme eastern Pacific near Ecuador), sea surface temperature anomalies over the month of February have consistently exceeded +1.5oC for the first time since December 2015.
In the subsurface ocean, above average temperatures (+2.0oC anomalies) are present in the western equatorial Pacific but remain near or slightly below average across the central and eastern equatorial Pacific. Rainfall and convection have been well below normal across the western equatorial Pacific, but above normal in the eastern equatorial Pacific toward the west coast of South America, a trait more typical of El Niño. The Southern Oscillation Index (SOI) was close to zero for February 2017 (-0.2) and zonal (westerly) wind anomalies have been marginally positive (indicating weaker than normal trade winds and in some spots westerly winds) in the central and eastern equatorial Pacific.
International guidance favours ENSO-neutral conditions with high probability (85% chance) over the next three month period (March – May 2017). Later during the year, models indicate significant chances for a return to El Niño conditions (over 50% in August – October 2017). It is important to note that ENSO forecasts going beyond the Southern Hemisphere autumn (Northern Hemisphere spring) are known to be less reliable than at other times of the year (the so-called “spring predictability barrier”). As of February 28th, the BoM has issued an “El Niño Watch” for 2017, citing a 50% chance for the development of El Niño conditions later this year.
Water temperatures surrounding New Zealand are close to average to the west of the country and average or above average to the east. Along the immediate New Zealand coastline, sea surface temperatures (SSTs) are generally near or above normal for the time of year, especially in the east. The dynamical models’ forecasts for SSTs indicate that this pattern is likely to persist over the next three month period. Thus, coastal waters around the country are expected to be near average as a whole in March – May 2017.
Though the 2016-17 tropical cyclone season got off to a slow start, February produced the season’s first tropical cyclones (near latest on record). The remainder of the season is expected to produce near normal tropical cyclone activity. Climatologically, March – May is the most active part of the tropical cyclone season. Refer to NIWA’s updated Tropical Cyclone Outlook at https://www.niwa.co.nz/news/southwest-pacific-tropical-cyclone-outlook-… for more information.
Contacts
For comment, please contact:
Chris Brandolino, Principal Scientist – Forecasting, NIWA National Climate Centre Tel (09) 375 6335, Mobile (027) 886 0014
Dr Brett Mullan, Principal Scientist, NIWA National Climate Centre Tel (04) 386 0508, Mobile (027) 294 1169
Notes to reporters and editors
- NIWA’s outlooks indicate the likelihood of climate conditions being at, above, or below average for the season as a whole. They are not ‘weather forecasts’. It is not possible to forecast precise weather conditions three months ahead of time.
- The outlooks are the result of the expert judgment of NIWA’s climate scientists. They take into account observations of atmospheric and ocean conditions and output from global and local climate models. The presence of El Niño or La Niña conditions and the sea surface temperatures around New Zealand can be a useful indicator of likely overall climate conditions for a season.
- The outlooks state the probability for above average conditions, near average conditions, and below average conditions for rainfall, temperature, soil moisture, and river flows. For example, for winter (June–July–August) 2007, for all the North Island, we assigned the following probabilities for temperature: · Above average: 60 per cent · Near average: 30 per cent · Below average: 10 per cent We therefore concluded that above average temperatures were very likely.
- This three-way probability means that a random choice would be correct only 33 per cent (or one-third) of the time. It would be like randomly throwing a dart at a board divided into three equal parts, or throwing a dice with three numbers on it. An analogy with coin tossing (a two-way probability) is not correct.
- A 50 per cent ‘hit rate’ is substantially better than guesswork, and comparable with the skill level of the best overseas climate outlooks. See, for example, analysis of global outlooks issued by the International Research Institute for Climate and Society based in the US published in the Bulletin of the American Meteorological Society (Goddard, L., A. G. Barnston, and S. J. Mason, 2003: Evaluation of the IRI’s “net assessment” seasonal climate forecasts 1997–2001. Bull. Amer. Meteor. Soc., 84, 1761–1781).
- Each month, NIWA publishes an analysis of how well its outlooks perform. This is available online and is sent to about 3500 recipients of NIWA’s newsletters, including many farmers.
- All outlooks are for the three months as a whole. There will inevitably be wet and dry days, and hot and cold days, within a season. The exact range in temperature and rainfall within each of the three categories varies with location and season. However, as a guide, the “near average” or middle category for the temperature predictions includes deviations up to ±0.5°C for the long-term mean, whereas for rainfall the “near normal” category lies between approximately 80 per cent and 115 per cent of the long-term mean.
- The seasonal climate outlooks are an output of a scientific research programme, supplemented by NIWA’s Capability Funding. NIWA does not have a government contract to produce these outlooks.
- Where probabilities are within 5% of one another, the term “about equally” is used.