Overview
The tropical Pacific continued to exhibit an ENSO (El Niño – Southern Oscillation) neutral state (neither El Niño nor La Niña) during May 2017, although is now close to the threshold of a weak El Niño. Across the entire equatorial Pacific, sea surface temperatures (SSTs) are near or marginally above normal. Ocean subsurface temperatures in the eastern equatorial Pacific rose markedly between the end of April and end of May, but there is no immediate indication that these warmer waters will be realised at the ocean’s surface. The Southern Oscillation Index (SOI) is currently negative with an estimated value of -0.1 for May 2017; i.e. suggestive of ENSO neutral conditions.
International guidance still suggests that a transition toward El Niño conditions over the next three month period (June – August 2017) is more likely than not, with a 57% chance, versus 42% chance for persistence of the current ENSO neutral state. Compared to last month, the forecast is less aggressive on El Niño development, now reaching a peak (60% chance) during the August-October 2017 period versus 69% last month.
The atmospheric circulation around New Zealand is forecast to favour more anticyclonic flows (high pressure) than normal to start the three month period of June – August 2017, bringing extended periods of settled weather.
For June – August 2017 as a whole, the atmospheric circulation around New Zealand is forecast to favour slightly more westerly wind flows than normal, but variable circulation patterns are to be expected over the course of the winter season.
Meteorologist Ben Noll provides some insight on weather patterns from June - August 2017.
Outlook summary
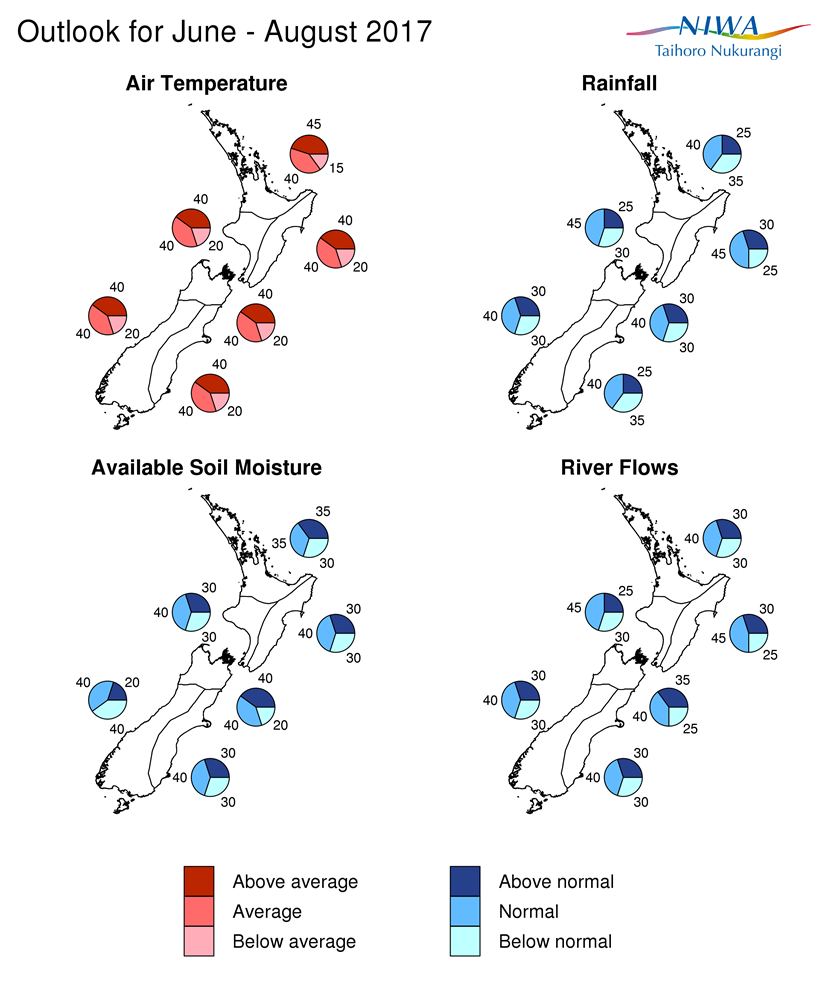
June – August 2017 temperatures are about equally likely to be above average (40% or 45% chance) or near average (40% chance) for all regions of New Zealand. Above average sea surface temperatures around New Zealand and the tendency for high pressure systems to persist near the country during June and into July 2017 are likely to contribute to average or above average temperatures to start the three month period. Nevertheless, frosts and cold snaps will occur during the winter season.
June – August 2017 rainfall totals are about equally likely to be near normal (40% chance) or below normal (35% chance) in the north of the North Island and east of the South Island. For all remaining regions of New Zealand, winter rainfall totals are most likely to be near normal (40 or 45% chance). From June into July 2017, frequent high pressure systems may contribute to extended periods of dry and settled weather across much of the country, however warm Tasman Sea surface temperatures may help to energise storms as they head toward the country from time to time.
June – August 2017 soil moisture levels are equally likely to be near normal (35% chance) or above normal (35% chance) in the north of the North Island while river flows are most likely to be near normal (40% chance). In the west and east of the North Island and east of the South Island, soil moisture levels and river flows are most likely to be in the near normal range (40-45% chance). The north of the South Island is about equally likely to have near normal or above normal soil moisture levels and river flows (35-40% chance). In the west of the South Island, soil moisture levels are equally likely to be near normal (40% chance) or below normal (40% chance) and river flows are most likely to be in the near normal range (40% chance).
Regional predictions for the June – August 2017 season
Northland, Auckland, Waikato, Bay of Plenty
The table below shows the probabilities (or percent chances) for each of three categories: above average, near average, and below average. In the absence of any forecast guidance there would be an equal likelihood (33% chance) of the outcome being in any one of the three categories. Forecast information from local and global guidance models is used to indicate the deviation from equal chance expected for the coming three month period, with the following outcomes the most likely (but not certain) for this region:
- Temperatures are about equally likely to be above average (45% chance) or near average (40% chance).
- Rainfall totals are about equally likely to be near normal (40% chance) or below normal (35% chance).
- Soil moisture levels are equally likely to be near normal (35% chance) or above normal (35% chance) and river flows are most likely to be near normal (40% chance).
The full probability breakdown is:
|
Temperature |
Rainfall |
Soil moisture |
River flows |
|
|
Above average |
45 |
25 |
35 |
30 |
|
Near average |
40 |
40 |
35 |
40 |
|
Below average |
15 |
35 |
30 |
30 |
Central North Island, Taranaki, Whanganui, Manawatu, Wellington
Probabilities are assigned in three categories: above average, near average, and below average.
- Temperatures are equally likely to be near average (40% chance) or above average (40% chance).
- Rainfall totals are most likely to be in the near normal range (45% chance).
- Soil moisture levels and river flows are most likely to be in the near normal range (40% or 45% chance).
The full probability breakdown is:
|
Temperature |
Rainfall |
Soil moisture |
River flows |
|
|
Above average |
40 |
25 |
30 |
25 |
|
Near average |
40 |
45 |
40 |
45 |
|
Below average |
20 |
30 |
30 |
30 |
Gisborne, Hawke’s Bay, Wairarapa
Probabilities are assigned in three categories: above average, near average, and below average.
- Temperatures are equally likely to be near average (40% chance) or above average (40% chance).
- Rainfall totals are most likely to be in the near normal range (45% chance).
- Soil moisture levels and river flows are most likely to be in the near normal range (40% or 45% chance).
The full probability breakdown is:
|
Temperature |
Rainfall |
Soil moisture |
River flows |
|
|
Above average |
40 |
30 |
30 |
30 |
|
Near average |
40 |
45 |
40 |
45 |
|
Below average |
20 |
25 |
30 |
25 |
Tasman, Nelson, Marlborough, Buller
Probabilities are assigned in three categories: above average, near average, and below average.
- Temperatures are equally likely to be near average (40% chance) or above average (40% chance).
- Rainfall totals are most likely to be in the near normal range (40% chance).
- Soil moisture levels are equally likely to be near normal (40% chance) or above normal (40% chance) and river flows are about equally likely to be near normal (40% chance) or above normal (35% chance).
The full probability breakdown is:
|
Temperature |
Rainfall |
Soil moisture |
River flows |
|
|
Above average |
40 |
30 |
40 |
35 |
|
Near average |
40 |
40 |
40 |
40 |
|
Below average |
20 |
30 |
20 |
25 |
West Coast, Alps and foothills, inland Otago, Southland
Probabilities are assigned in three categories: above average, near average, and below average.
- Temperatures are equally likely to be near average (40% chance) or above average (40% chance).
- Rainfall totals are most likely to be in the near normal range (40% chance).
- Soil moisture levels are equally likely to be near normal (40% chance) or below normal (40% chance) and river flows are most likely to be near normal (40% chance).
The full probability breakdown is:
|
Temperature |
Rainfall |
Soil moisture |
River flows |
|
|
Above average |
40 |
30 |
20 |
30 |
|
Near average |
40 |
40 |
40 |
40 |
|
Below average |
20 |
30 |
40 |
30 |
Coastal Canterbury, east Otago
Probabilities are assigned in three categories: above average, near average, and below average.
- Temperatures are equally likely to be near average (40% chance) or above average (40% chance).
- Rainfall totals are about equally likely to be near normal (40% chance) or below normal (35% chance).
- Soil moisture levels and river flows are most likely to be in the near normal range (40% chance).
The full probability breakdown is:
|
Temperature |
Rainfall |
Soil moisture |
River flows |
|
|
Above average |
40 |
25 |
30 |
30 |
|
Near average |
40 |
40 |
40 |
40 |
|
Below average |
20 |
35 |
30 |
30 |
Graphical representation of the regional probabilities
Background
The tropical Pacific remains in El Niño-Southern Oscillation (ENSO) neutral state, although is now close to the threshold of a weak El Niño. Sea surface temperatures (SSTs) are near or above average across the entire equatorial Pacific. Despite this, there is little indication that further warming will occur during June 2017 due to enhanced equatorial trade winds.
Subsurface temperature anomalies along the equator have risen markedly between the end of April and end of May, as a significant anomaly of +3.0oC developed between about 25 and 75 m depth in the eastern equatorial Pacific. Toward the central equatorial Pacific, ocean subsurface temperature anomalies have reached +1.0oC as far west as 155oW. An appreciable slackening in equatorial trade winds is needed to have warmer SSTs realised at the ocean’s surface, something that does not appear likely to start the next three month period. While these developments across the oceanic subsurface are intriguing, the ocean generally still remains in an ENSO neutral state and does not indicate a strong potential for a quick transition towards El Niño.
The preliminary Southern Oscillation Index (SOI) for the month of May 2017 is negative at -0.1 (neutral). Zonal wind anomalies along the equator were close to zero during May and generally large-scale circulation patterns are consistent with an ENSO-neutral state. Rainfall and convection anomalies have been mixed over the past month and still subtly reflect weak La Niña conditions, with enhanced convection and rainfall affecting parts of Southeast Asia.
International guidance indicates that a transition toward El Niño conditions over the next three month period (June – August 2017) is more likely than not, with a 57% chance, versus 42% chance for persistence of the current ENSO neutral conditions. Dynamical and statistical models now indicate a 60% peak of El Niño likelihood during August – October 2017, which is down 9% from a peak of 69% as models forecast last month (for the same three month period). The so called “spring predictability barrier” is likely becoming less of a factor now that summer has arrived in the Northern Hemisphere. Therefore, there is reason to believe that more recent ENSO forecasts for later in 2017 are more skilful than ones made earlier in the year.
SSTs surrounding New Zealand remain warmer than average all around the country, with anomalies exceeding +1.0oC along the west coast of the South Island and east of the North Island and close to +1.0oC along the north of the North Island. SSTs remain much warmer than average in the southern part of the Tasman Sea and off the coast of southeast Australia. Warmer than average SSTs may help to “lessen the sting” of any colder southerly outbreak, especially early in the June – August 2017 period.
The dynamical models’ forecasts indicate that warmer than average SSTs around New Zealand are likely to persist through June and either remain above average or near average through the winter season as a whole. Thus, for June – August 2017, coastal waters around New Zealand are forecast to be average or above average.
Contacts
Chris Brandolino, Principal Scientist – Forecasting Services, NIWA National Climate Centre Tel (09) 375 6335, Mobile (027) 886 0014
Dr Brett Mullan, Principal Scientist, NIWA National Climate Centre Tel (04) 386 0508, Mobile (027) 294 1169
Notes to reporters and editors
- NIWA’s outlooks indicate the likelihood of climate conditions being at, above, or below average for the season as a whole. They are not ‘weather forecasts’. It is not possible to forecast precise weather conditions three months ahead of time.
- The outlooks are the result of the expert judgment of NIWA’s climate scientists. They take into account observations of atmospheric and ocean conditions and output from global and local climate models. The presence of El Niño or La Niña conditions and the sea surface temperatures around New Zealand can be a useful indicator of likely overall climate conditions for a season.
- The outlooks state the probability for above average conditions, near average conditions, and below average conditions for rainfall, temperature, soil moisture, and river flows. For example, for winter (June–July–August) 2007, for all the North Island, we assigned the following probabilities for temperature: · Above average: 60 per cent · Near average: 30 per cent · Below average: 10 per cent We therefore concluded that above average temperatures were very likely.
- This three-way probability means that a random choice would be correct only 33 per cent (or one-third) of the time. It would be like randomly throwing a dart at a board divided into three equal parts, or throwing a dice with three numbers on it. An analogy with coin tossing (a two-way probability) is not correct.
- A 50 per cent ‘hit rate’ is substantially better than guesswork, and comparable with the skill level of the best overseas climate outlooks. See, for example, analysis of global outlooks issued by the International Research Institute for Climate and Society based in the US published in the Bulletin of the American Meteorological Society (Goddard, L., A. G. Barnston, and S. J. Mason, 2003: Evaluation of the IRI’s “net assessment” seasonal climate forecasts 1997–2001. Bull. Amer. Meteor. Soc., 84, 1761–1781).
- Each month, NIWA publishes an analysis of how well its outlooks perform. This is sent to about 3500 recipients of NIWA’s newsletters, including many farmers.
- All outlooks are for the three months as a whole. There will inevitably be wet and dry days, and hot and cold days, within a season. The exact range in temperature and rainfall within each of the three categories varies with location and season. However, as a guide, the “near average” or middle category for the temperature predictions includes deviations up to ±0.5°C for the long-term mean, whereas for rainfall the “near normal” category lies between approximately 80 per cent and 115 per cent of the long-term mean.
- The seasonal climate outlooks are an output of a scientific research programme, supplemented by NIWA’s Capability Funding. NIWA does not have a government contract to produce these outlooks.
- Where probabilities are within 5% of one another, the term “about equally” is used.