Overview
El Nino – Southern Oscillation (ENSO) neutral conditions continued across the tropical Pacific during June 2018. The Southern Oscillation Index (SOI) was slightly negative at about -0.7 during the past 30 days (on the El Niño side of neutral). The central equatorial Pacific experienced warming sea surface temperatures (SSTs) for the third consecutive month and was slightly above average for the time of year.
SSTs in the eastern equatorial Pacific remained slightly cooler than average for the time of year. The current anomaly configuration (warmer west, cooler east) is consistent with the development of El Niño-Modoki (central Pacific warm event).
The consensus from international models is for the tropical Pacific to persist in an ENSO-neutral state over the next three-month period (52% chance over July – September 2018). However, El Niño conditions become favoured in the following three-month period (54% chance over August – October 2018), peaking in December 2018 – February 2019 at a 71% chance.
The atmospheric circulation around New Zealand is expected to be characterized by mixed flow patterns along with periodic easterly quarter flows. Consequently, the disturbed circulation pattern is anticipated to produce episodic southerly quarter flows with sharp but short-lived cold snaps and snowfall. Periodic easterly quarter flows will act as a counterbalance, bringing milder temperatures and heavy rain events to the northern and eastern North Island and eastern South Island.
Outlook Summary
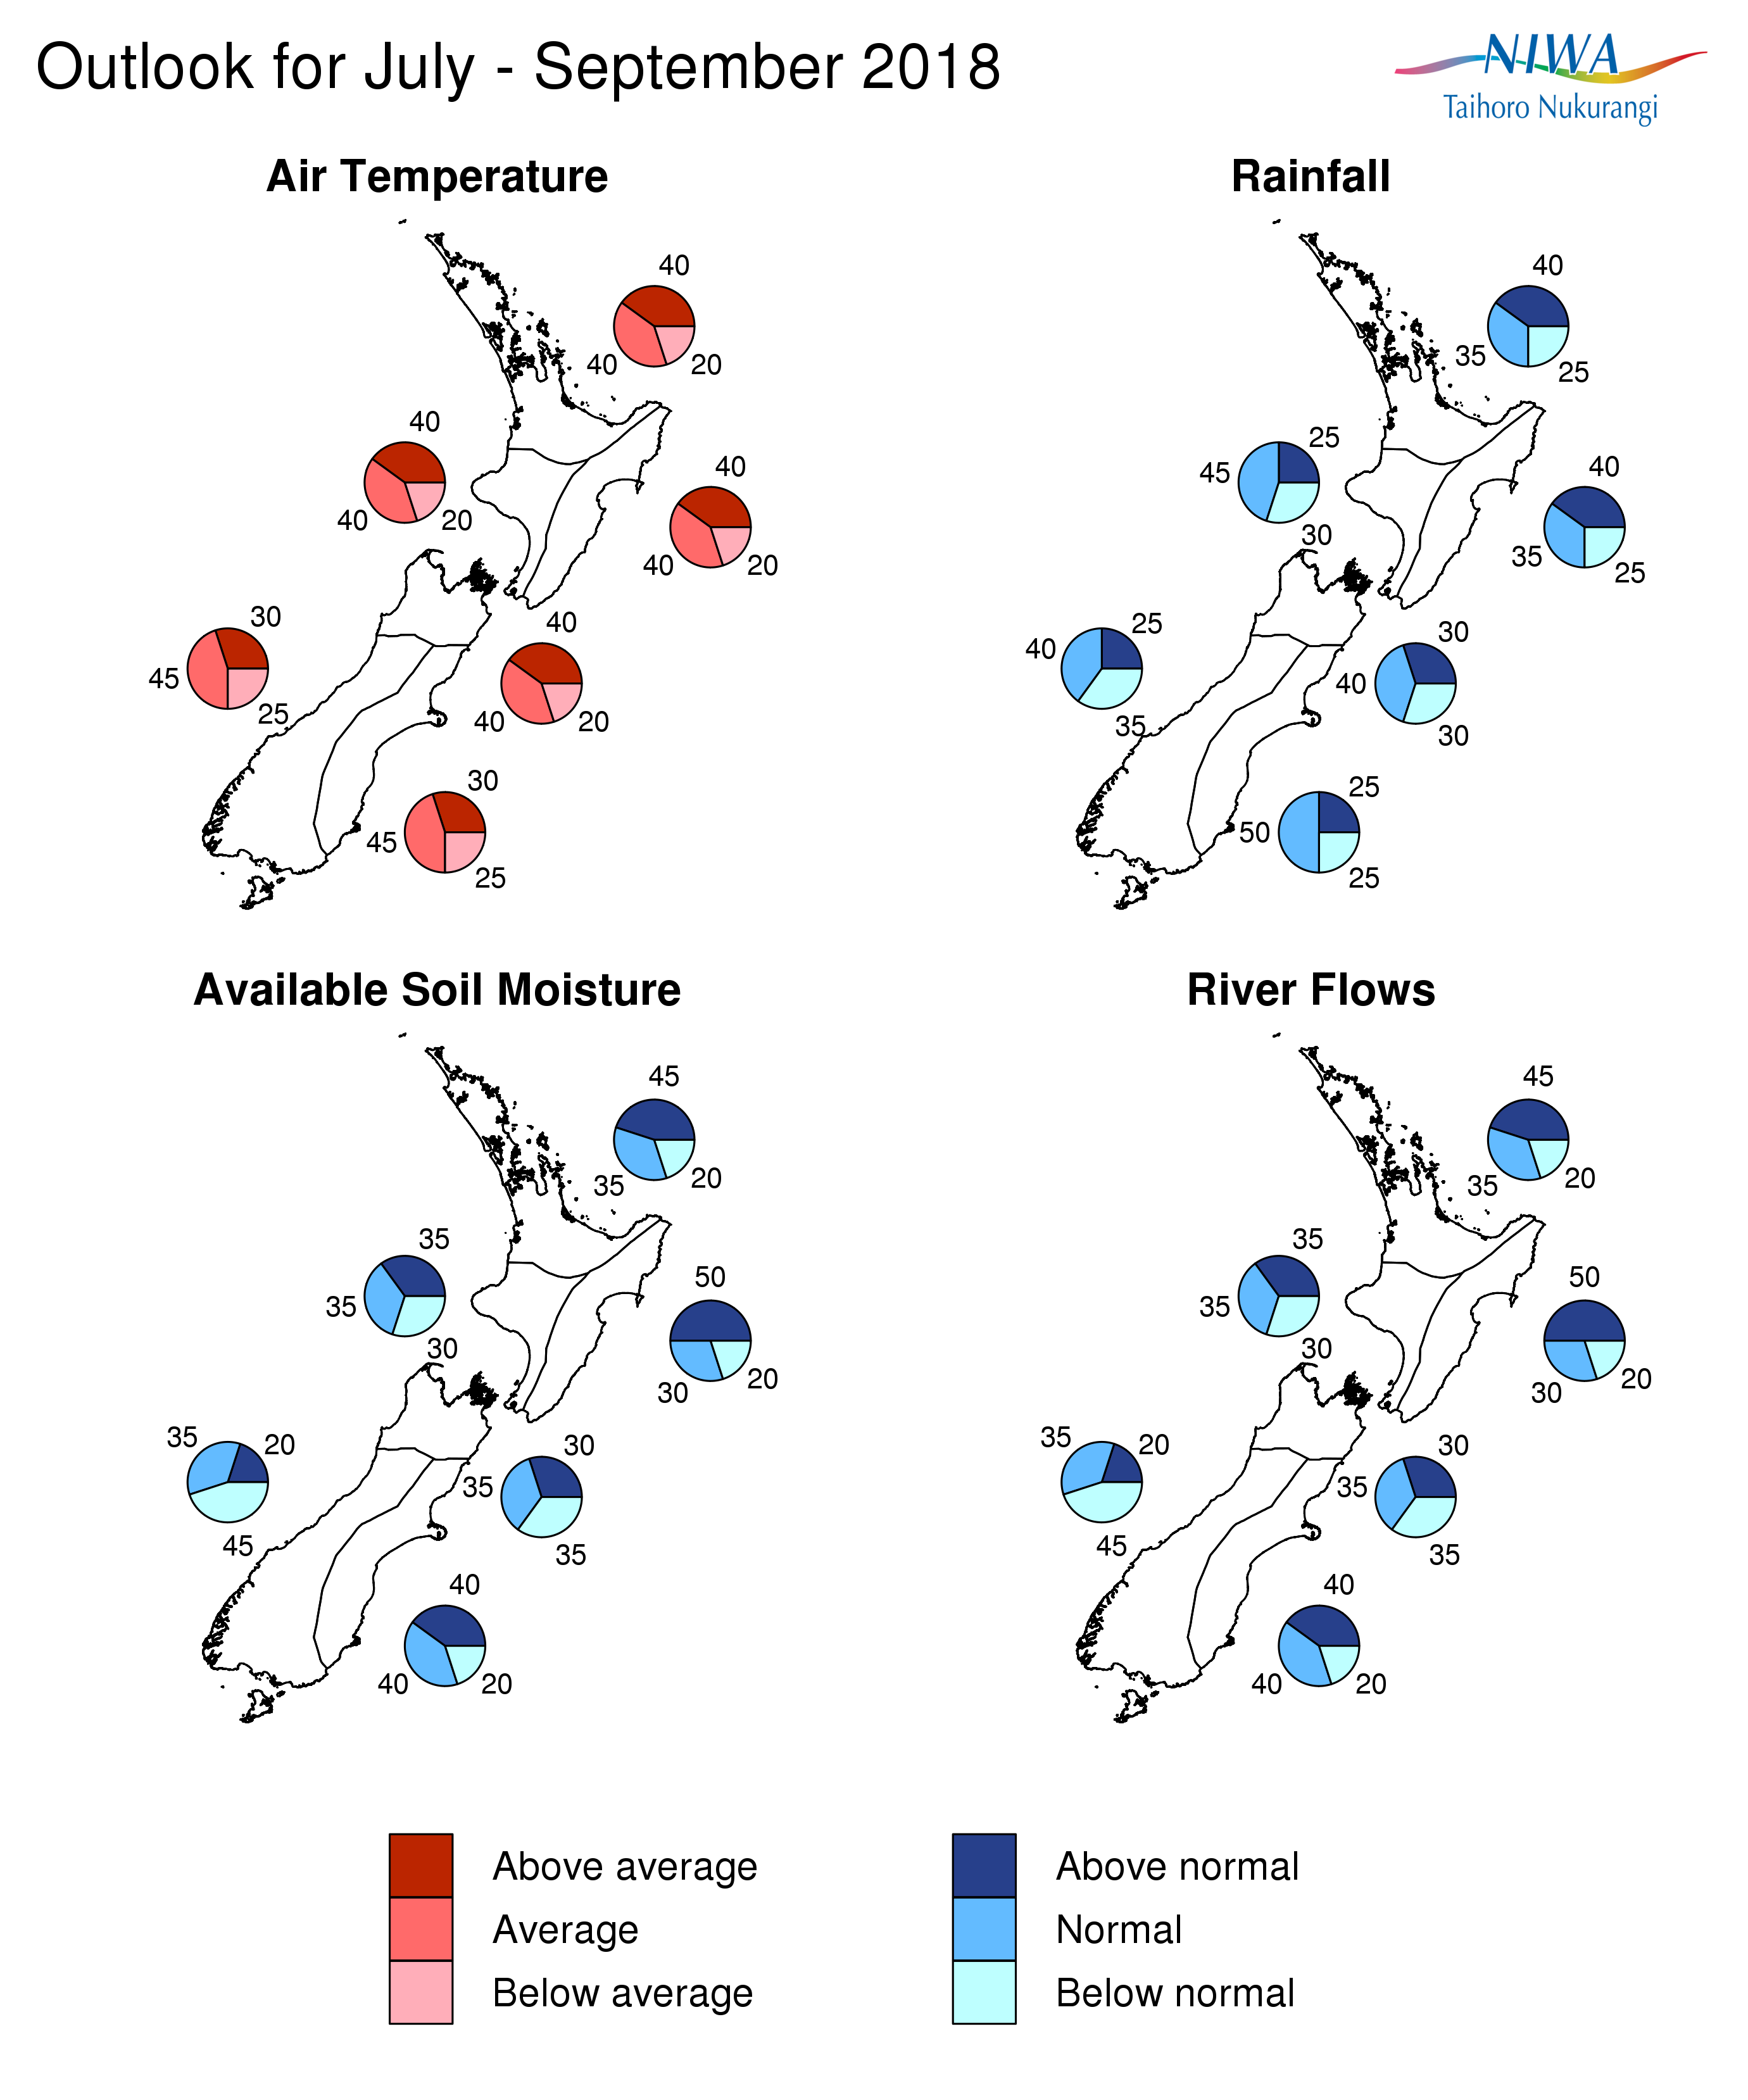
July – September 2018 temperatures are forecast to be near average (40% chance) or above average (40% chance) for the North Island and north of the South Island. Near average (45% chance) temperatures are expected for the east and west of the South Island. Periodic easterly quarter (SE to NE) flow may bring mild periods, especially to northern areas. Westerly quarter (NW to SW) winds will increase the risk for cold snaps, particularly for the South Island during mid-July.
July – September 2018 rainfall totals are forecast to be near normal (35% chance) or above normal (40% chance) in the north and east of the North Island. Normal (40 – 50 % chance) rainfall is forecast in the west of both islands as well as the north of the South Island with near normal (40% chance) or below normal (35% chance) rainfall expected in the west of the South Island. Lower than normal air pressure to the north and east of New Zealand during may bring a few heavier rain events to the north and east of the North Island and perhaps east of the South Island, potentially during late-July.
July – September 2018 soil moisture levels and river flows are expected to be above normal (45% chance) for the north and east of the North Island, with an equally likely chance (30-35%) of normal or above normal conditions for the west of the North Island. For the north of the South Island, soil moisture levels and river levels are equally likely to be near normal or below normal (30-35% chance). For the east of the South Island, soil moisture levels and rivers flows are equally likely (40% chance) to be near normal or above normal with below normal soil moisture levels and river flows likely (45% chance) for the west of the South Island.
Regional predictions for the July – September 2018 season
Northland, Auckland, Waikato, Bay of Plenty
The table below shows the probabilities (or percent chances) for each of three categories: above average, near average, and below average. In the absence of any forecast guidance there would be an equal likelihood (33% chance) of the outcome being in any one of the three categories. Forecast information from local and global guidance models is used to indicate the deviation from equal chance expected for the coming three-month period, with the following outcomes the most likely (but not certain) for this region:
- Temperatures are equally likely to be near average or above average (40% chance).
- Rainfall totals are about equally likely to be near normal (35% chance) or above normal (40% chance).
- Soil moisture levels and river flows are most likely to be above normal (45% chance).
The full probability breakdown is:
|
Temperature |
Rainfall |
Soil moisture |
River flows |
|
|
Above average |
40 |
40 |
45 |
45 |
|
Near average |
40 |
35 |
35 |
35 |
|
Below average |
20 |
25 |
20 |
20 |
Central North Island, Taranaki, Whanganui, Manawatu, Wellington
Probabilities are assigned in three categories: above average, near average, and below average.
- Temperatures are equally likely to be near average or above average (40% chance).
- Rainfall totals are most likely to be near normal (45% chance).
- Soil moisture levels and river flows are equally likely to be near normal or above normal (35% chance).
The full probability breakdown is:
|
Temperature |
Rainfall |
Soil moisture |
River flows |
|
|
Above average |
40 |
25 |
35 |
35 |
|
Near average |
40 |
45 |
35 |
35 |
|
Below average |
20 |
30 |
30 |
30 |
Gisborne, Hawke’s Bay, Wairarapa
Probabilities are assigned in three categories: above average, near average, and below average.
- Temperatures are equally likely to be near average or above average (40% chance).
- Rainfall totals are about equally likely to be near normal (35% chance) or above normal (40% chance).
- Soil moisture levels and river flows are most likely to be above normal (50% chance).
The full probability breakdown is:
|
Temperature |
Rainfall |
Soil moisture |
River flows |
|
|
Above average |
40 |
40 |
50 |
50 |
|
Near average |
40 |
35 |
30 |
30 |
|
Below average |
20 |
25 |
20 |
20 |
Tasman, Nelson, Marlborough, Buller
Probabilities are assigned in three categories: above average, near average, and below average.
- Temperatures are equally likely to be near average or above average (40% chance).
- Rainfall totals are most likely to be near normal (40% chance).
- Soil moisture levels and river flows are equally likely to be near normal or below normal (35% chance).
The full probability breakdown is:
|
Temperature |
Rainfall |
Soil moisture |
River flows |
|
|
Above average |
40 |
30 |
30 |
30 |
|
Near average |
40 |
40 |
35 |
35 |
|
Below average |
20 |
30 |
35 |
35 |
West Coast, Alps and foothills, inland Otago, Southland
Probabilities are assigned in three categories: above average, near average, and below average.
- Temperatures are most likely to be near average (45% chance).
- Rainfall totals are about equally likely to be near normal (40% chance) or below normal (35% chance).
- Soil moisture levels and river flows are most likely to be below normal (45% chance).
The full probability breakdown is:
|
Temperature |
Rainfall |
Soil moisture |
River flows |
|
|
Above average |
30 |
25 |
20 |
20 |
|
Near average |
45 |
40 |
35 |
35 |
|
Below average |
25 |
35 |
45 |
45 |
Coastal Canterbury, east Otago
Probabilities are assigned in three categories: above average, near average, and below average.
- Temperatures are most likely to be near average (45% chance).
- Rainfall totals most likely to be in the near normal (50% chance).
- Soil moisture levels, and river flows are about equally likely to be near normal or above normal (40% chance).
The full probability breakdown is:
|
Temperature |
Rainfall |
Soil moisture |
River flows |
|
|
Above average |
30 |
25 |
40 |
40 |
|
Near average |
45 |
50 |
40 |
40 |
|
Below average |
25 |
25 |
20 |
20 |
Graphical representation of the regional probabilities
Background
El Niño – Southern Oscillation (ENSO) neutral conditions continued across the tropical Pacific during June 2018. The Southern Oscillation Index (SOI) was slightly negative at about -0.7 during the past 30 days. The central equatorial Pacific experienced warming sea surface temperatures (SSTs) for the third consecutive month and was slightly above average for the time of year. SSTs in the eastern equatorial Pacific remained slightly cooler than average for the time of year. The current SST anomaly pattern (warmer west, cooler east) is consistent with the developing stages of El Niño-Modoki.
Since the potential ENSO event is early in its life cycle, the impact on New Zealand for later in 2018 remains unclear. The location of the largest positive SST anomalies (central equatorial Pacific vs eastern equatorial Pacific) will be important to monitor over the next several months.
In the subsurface ocean, (within the first 150 metres of the ocean) positive temperature anomalies extend from the western Pacific (near 160°E) to the South American coast. Significant positive anomalies (> +3.0°C) have migrated from the central Pacific during May to the eastern Pacific during June at 50-100m depth. Positive anomalies of +2.0°C extend to 25m depth from about 130°W to the coast of South America and appear poised to surface in the basin over the upcoming months.
Following the pattern of reduced trade winds or westerly winds near and north of the equator during June, July is expected to bring periods of enhanced easterlies in the central and eastern equatorial Pacific. This circulation pattern may temporarily pause the warming that was observed recently; sub-seasonal guidance then indicates a return of reduced trade winds from late July.
June 2018 saw convective anomalies shift from the Indian Ocean to the tropical and sub-tropical North Pacific. Warming SSTs in the region influenced the change, and, despite intraseasonal variability, are generally expected to continue over the next three-month period. A much cooler than average tropical and sub-tropical Atlantic Ocean will likely be associated with enhanced regional convergence and influence the Walker Circulation toward an El Niño-like state from late July.
As a result, The ENSO Precipitation Index (ESPI) was -0.35 for June; above normal rainfall occurred rather uniformly along and north of the equator in the tropical Pacific, a general indicator of ENSO-neutral conditions.
The Intertropical Convergence Zone remained north of its climatological position in the central Pacific and the South Pacific Convergence Zone was south of its climatological position.
The analysis of several atmospheric and oceanic indicators showed that the climate system remained in an ENSO-neutral state during June 2018. However, warming temperatures across the subsurface and surface waters in the equatorial Pacific, weaker than normal trade winds, and convective anomalies broadly indicative of El Niño may indicate the trend of the climate system for spring 2018.
In the meantime, ENSO-neutral conditions are expected to continue over the next several months (67% chance over June – August 2018). The forecast models then favour El Niño conditions during late winter and spring (August – October 2018).
SSTs remain warmer than average to the east and north of New Zealand while an area of near or below average SSTs persisted in the Tasman Sea. Anomalies within New Zealand’s immediate coastal waters persisted near average during June. Coastal anomalies for the past three months are between 0.30-0.50°C above average for all regions of the country.
In the absence of large-scale climate drivers and near-average regional SSTs, forecast predictability outside of the tropics, including New Zealand, may be lower than normal over the coming three month period.
Contact
Chris Brandolino, Principal Scientist – Forecasting, NIWA National Climate Centre Tel (09) 375 6335, Mobile (027) 886 0014
Ben Noll, Meteorologist, NIWA National Climate Centre Tel (09) 375 6334, Mobile (027) 405 3052
Notes to reporters and editors
- NIWA’s outlooks indicate the likelihood of climate conditions being at, above, or below average for the season as a whole. They are not ‘weather forecasts’. It is not possible to forecast precise weather conditions three months ahead of time.
- The outlooks are the result of the expert judgment of NIWA’s climate scientists. They take into account observations of atmospheric and ocean conditions and output from global and local climate models. The presence of El Niño or La Niña conditions and the sea surface temperatures around New Zealand can be a useful indicator of likely overall climate conditions for a season.
- The outlooks state the probability for above average conditions, near average conditions, and below average conditions for rainfall, temperature, soil moisture, and river flows. For example, for winter (June–July–August) 2007, for all the North Island, we assigned the following probabilities for temperature: · Above average: 60 per cent · Near average: 30 per cent · Below average: 10 per cent We therefore concluded that above average temperatures were very likely.
- This three-way probability means that a random choice would be correct only 33 per cent (or one-third) of the time. It would be like randomly throwing a dart at a board divided into three equal parts, or throwing a dice with three numbers on it. An analogy with coin tossing (a two-way probability) is not correct.
- A 50 per cent ‘hit rate’ is substantially better than guesswork, and comparable with the skill level of the best overseas climate outlooks. See, for example, analysis of global outlooks issued by the International Research Institute for Climate and Society based in the US published in the Bulletin of the American Meteorological Society (Goddard, L., A. G. Barnston, and S. J. Mason, 2003: Evaluation of the IRI’s “net assessment” seasonal climate forecasts 1997–2001. Bull. Amer. Meteor. Soc., 84, 1761–1781).
- Each month, NIWA publishes an analysis of how well its outlooks perform. This is available online and is sent to about 3500 recipients of NIWA’s newsletters, including many farmers.
- All outlooks are for the three months as a whole. There will inevitably be wet and dry days, and hot and cold days, within a season. The exact range in temperature and rainfall within each of the three categories varies with location and season. However, as a guide, the “near average” or middle category for the temperature predictions includes deviations up to ±0.5°C for the long-term mean, whereas for rainfall the “near normal” category lies between approximately 80 per cent and 115 per cent of the long-term mean.
- The seasonal climate outlooks are an output of a scientific research programme, supplemented by NIWA’s Capability Funding. NIWA does not have a government contract to produce these outlooks.
- Where probabilities are within 5% of one another, the term “about equally” is used.