Outlook Summary
- La Niña continued during November and a marine heatwave developed in Aotearoa New Zealand’s coastal waters with sea surface temperatures 1.1˚C to 1.7˚C above average. Both will influence the summer climate. See the background for more information.
- Summer air pressure is forecast to be higher than normal over and to the south of the South Island and lower than normal north of the country. This will likely result in an easterly quarter air flow anomaly and fewer westerly winds over the three months as a whole.
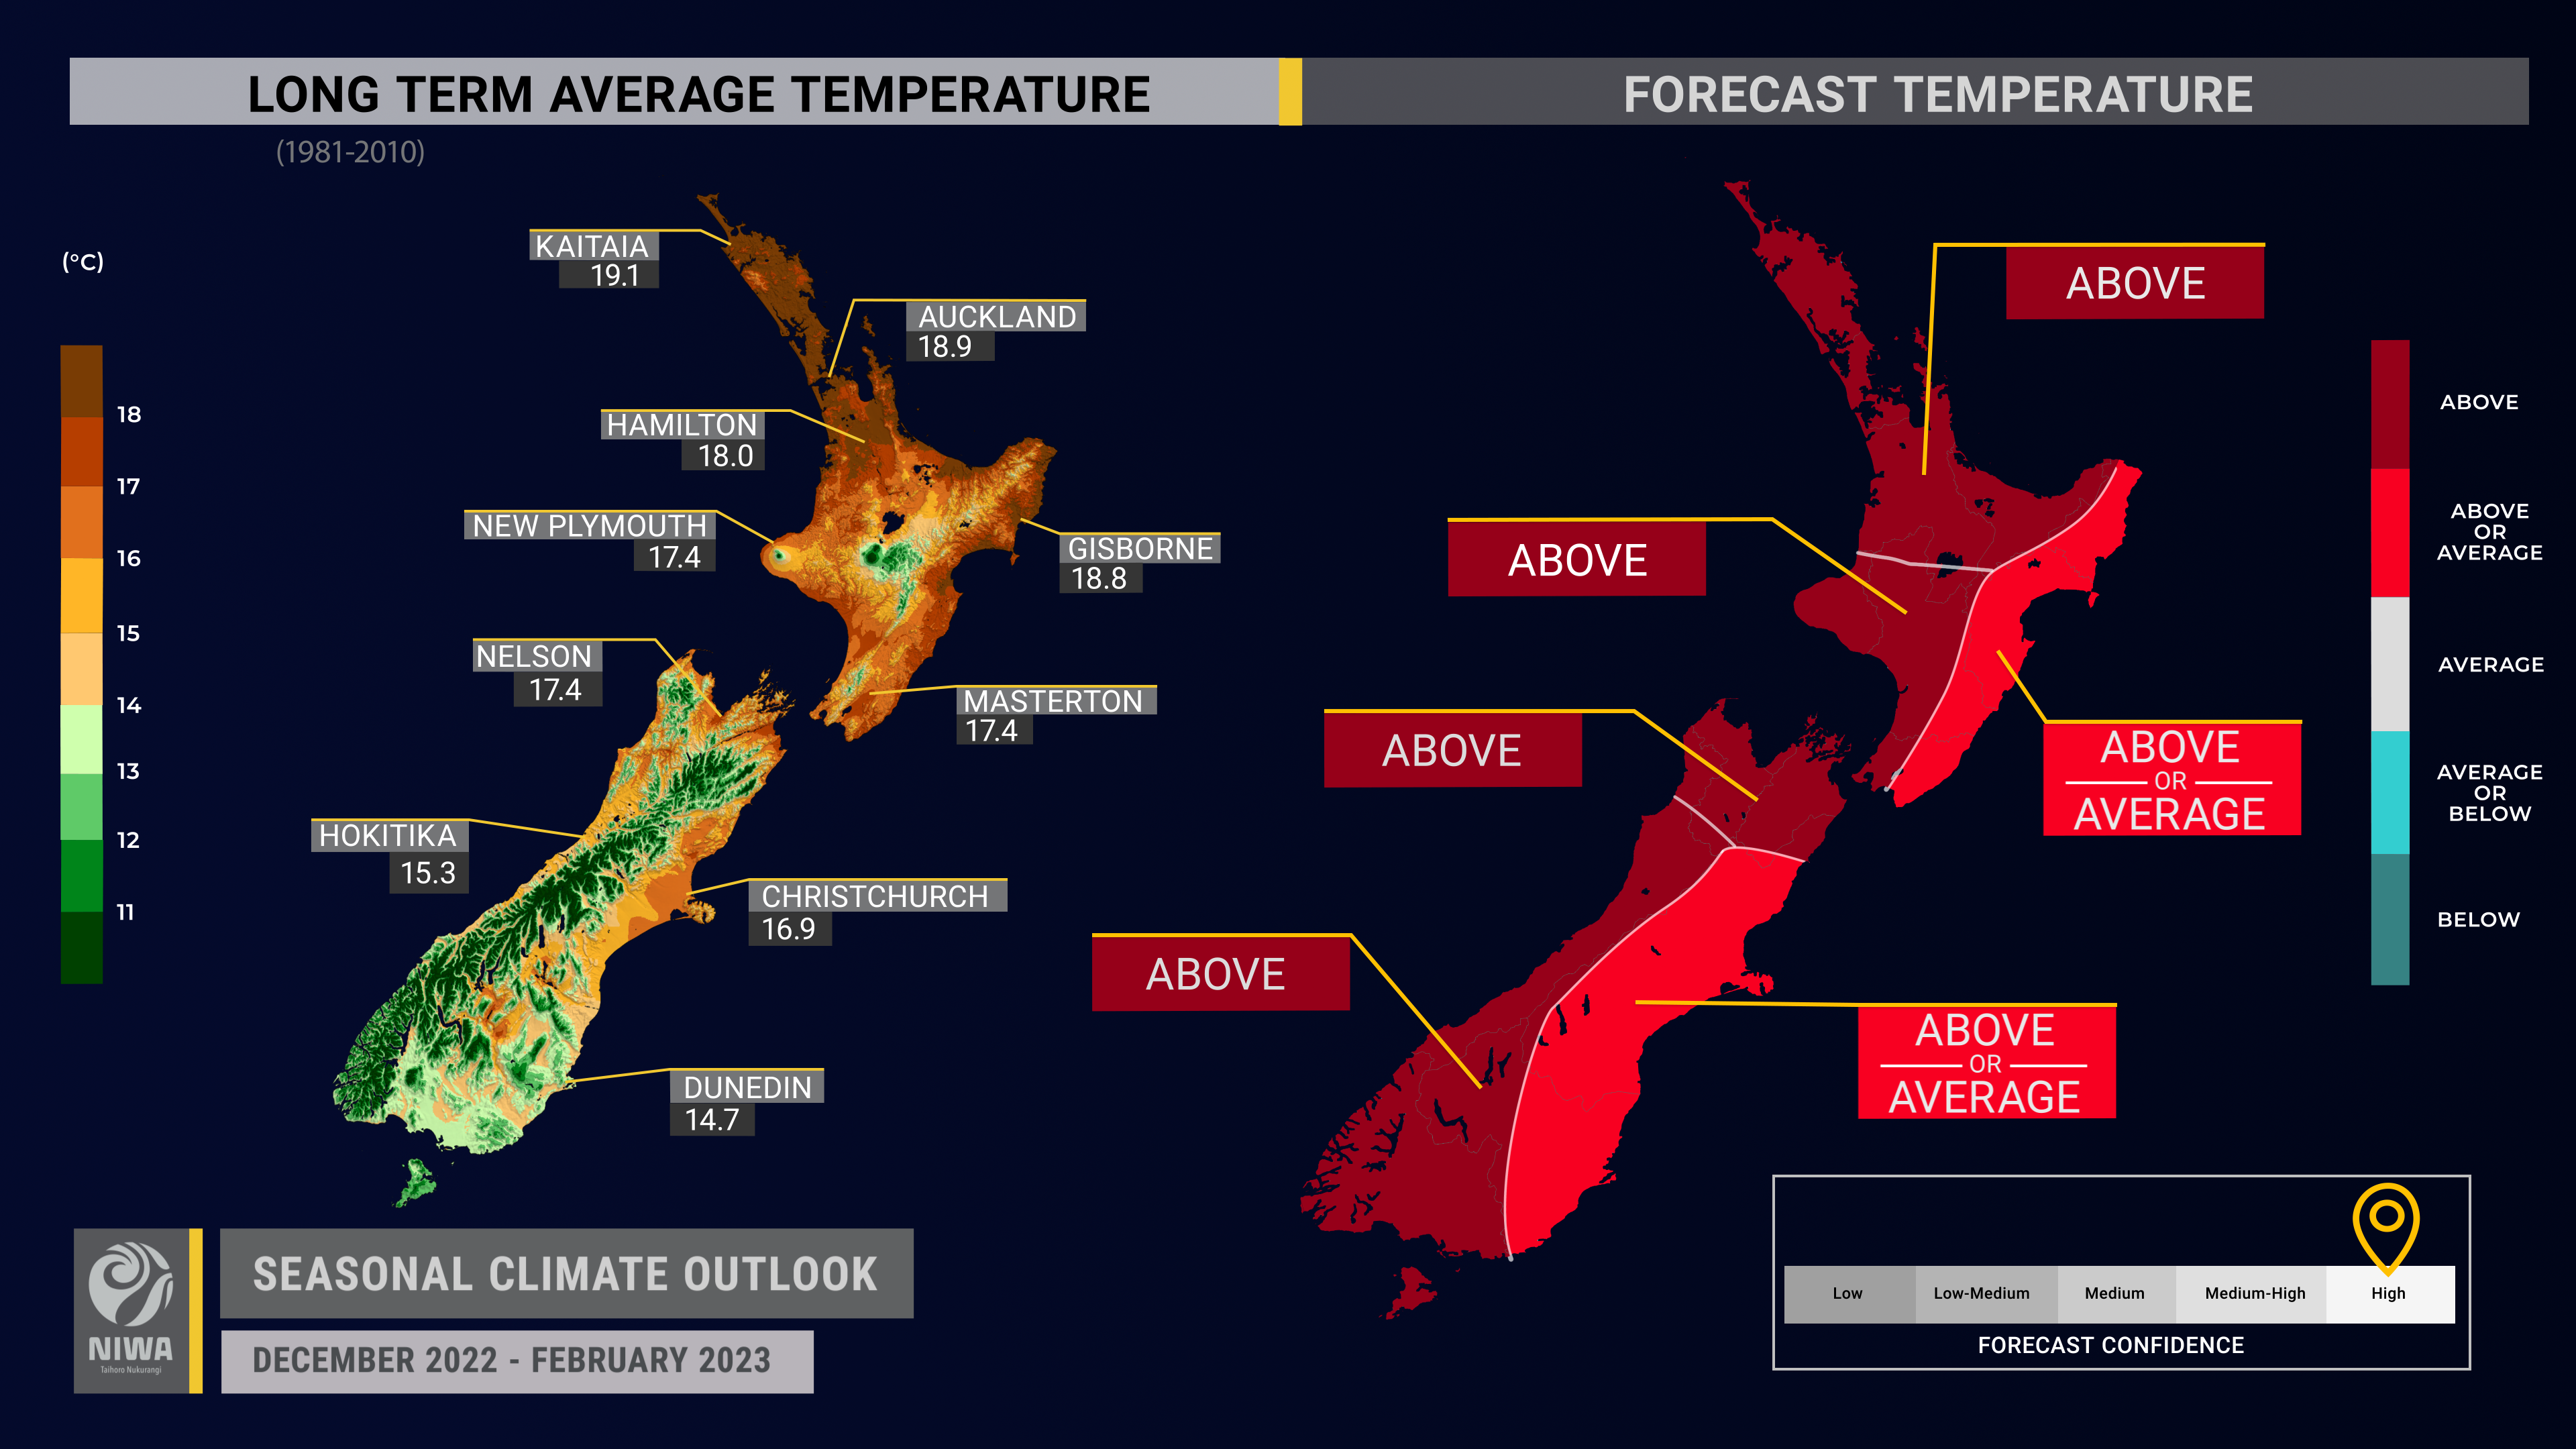
- Summer temperatures are about equally likely to be near average or above average in the east of both islands, very likely to be above average in the north of the North Island and the west of both islands, and most likely to be above average in the north of the South Island.
- More sub-tropical northeast winds may result in more frequent hot days (>25˚C) for inland and western parts of both islands. Conversely, a reduction in northwesterly “foehn” winds will likely mean fewer hot days for eastern areas.
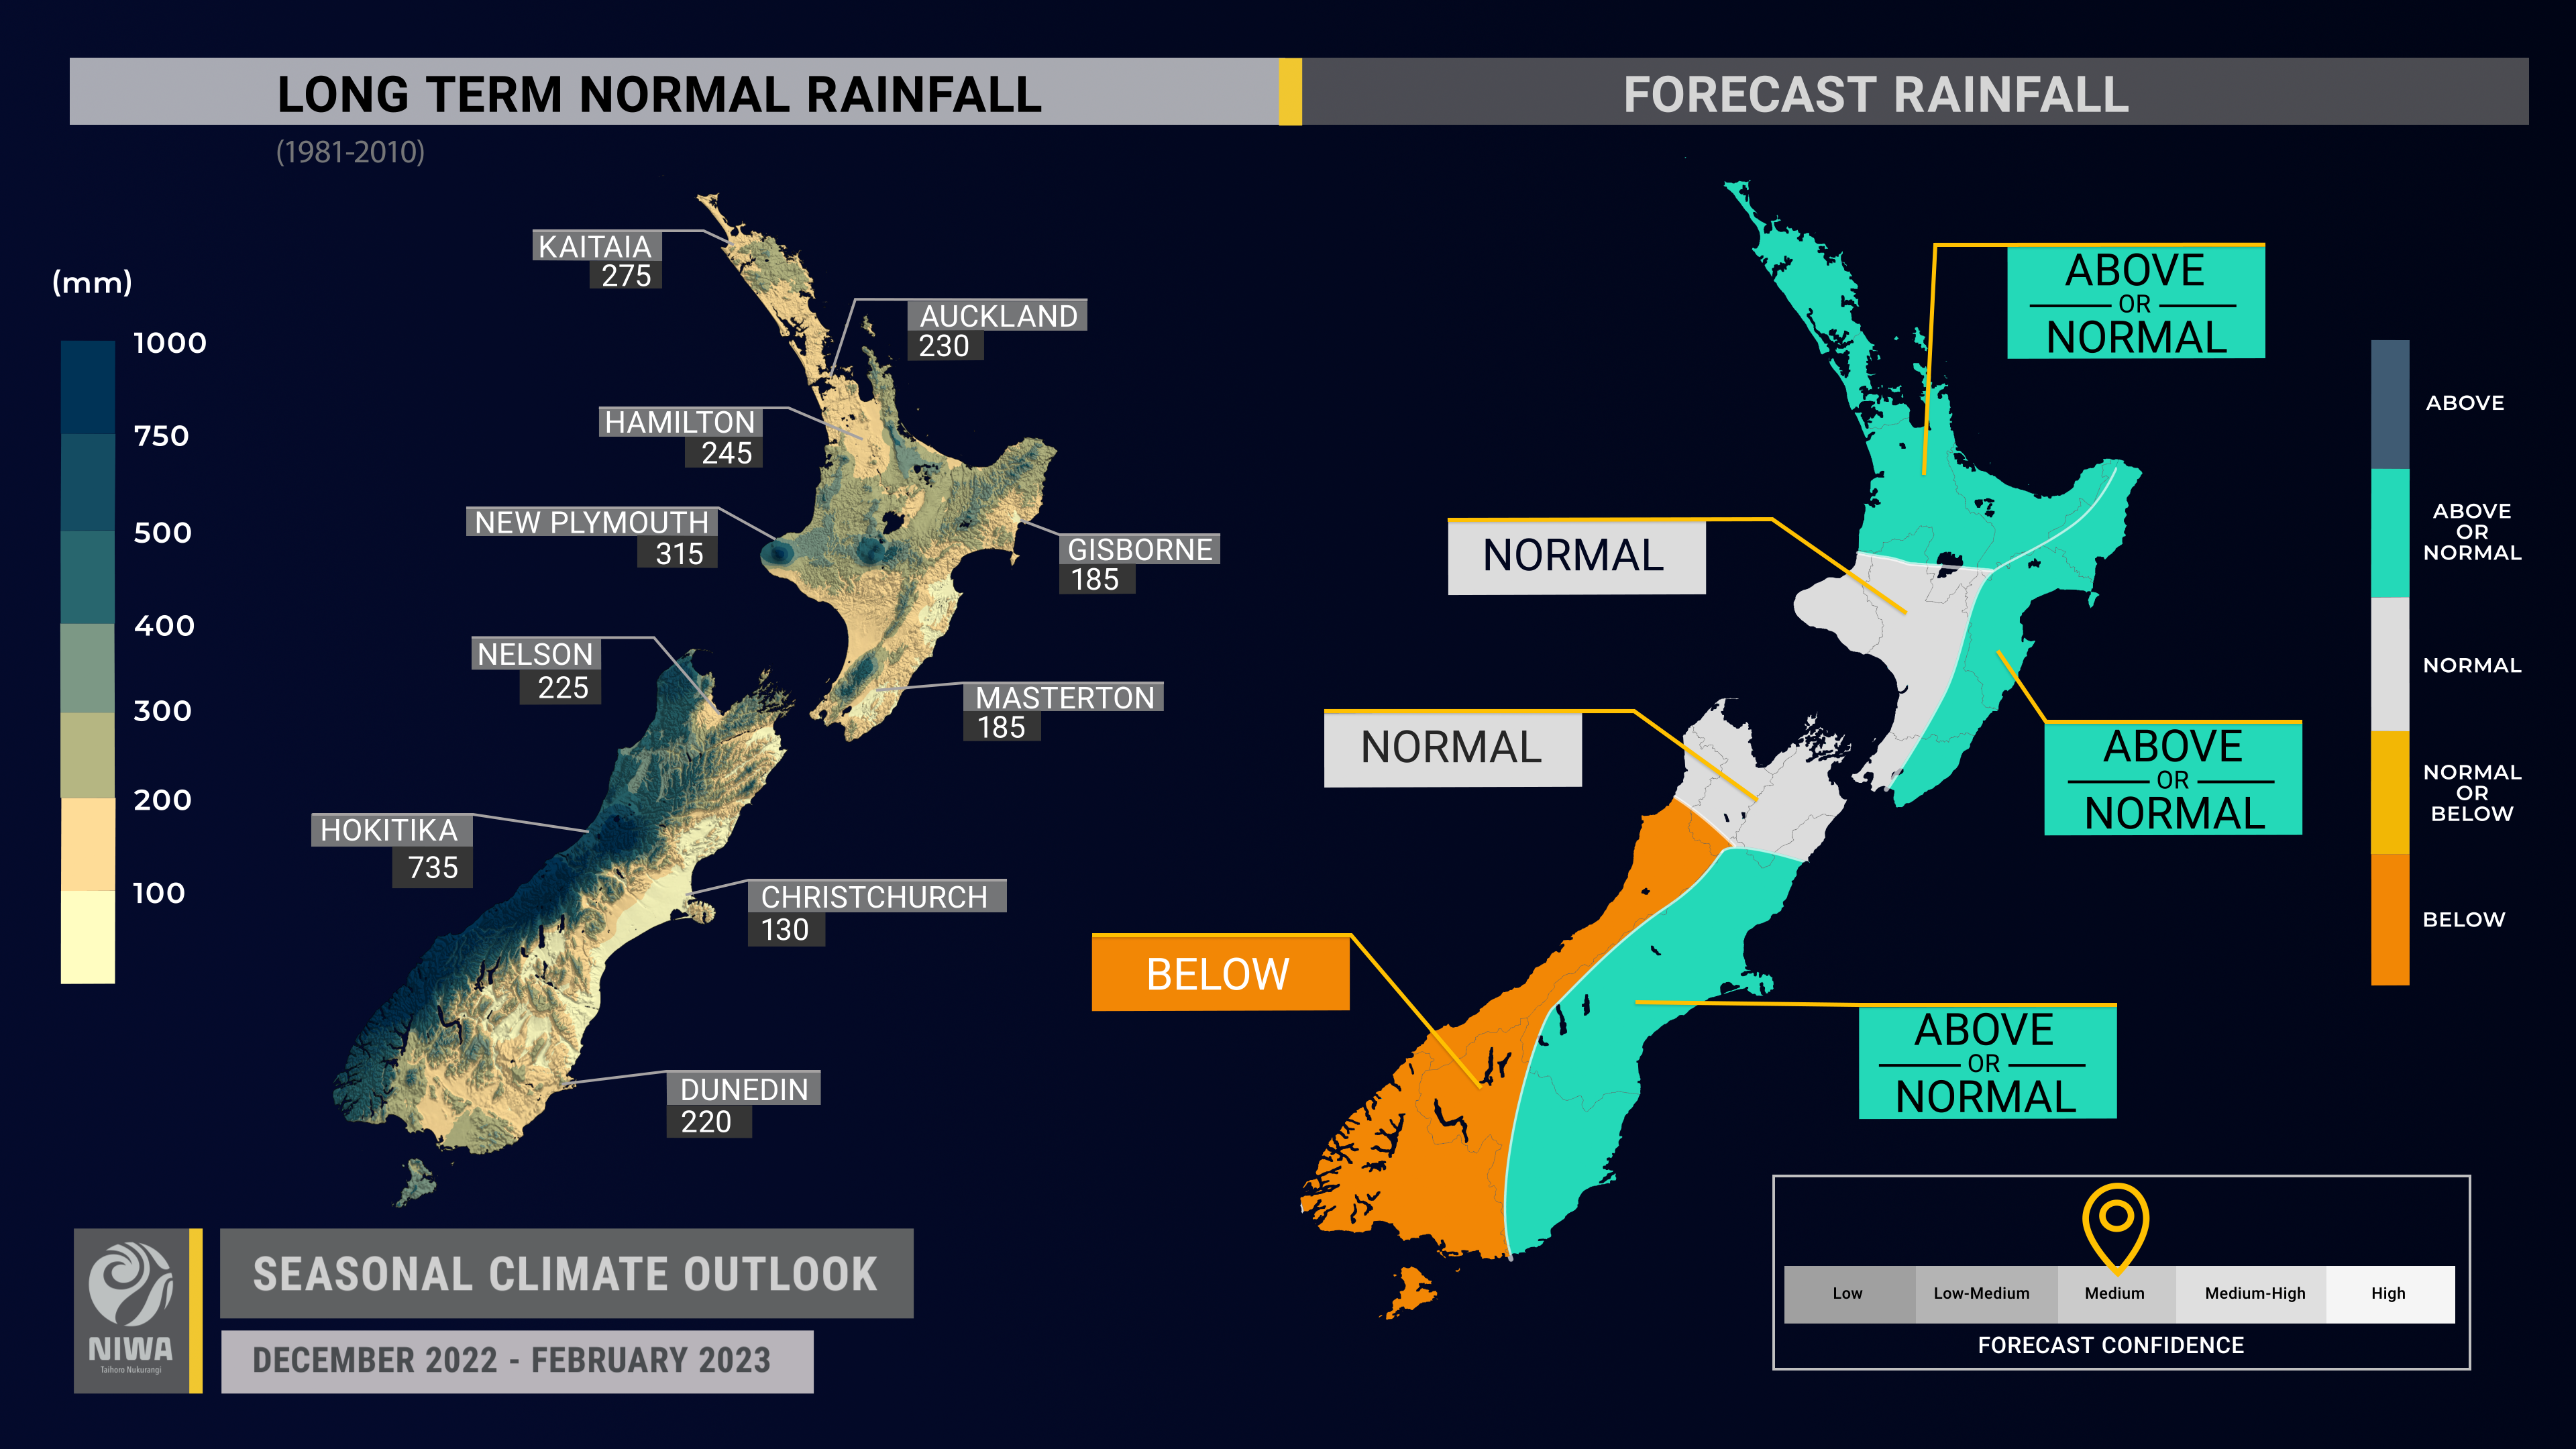
- Summer rainfall is about equally likely to be near normal or above normal in the north of the North Island and the east of both islands, most likely to be near normal in the west of the North Island and north of the South Island, and most likely to be below normal in the west of the South Island.
- Warmer than average regional seas are expected to fuel occasional heavy rainfall events; however, during periods of high pressure, dry spells will occur, particularly about inland and western parts of both islands. A dry spell is possible from mid-December to early January.
- The risk for dryness and drought is elevated about the western and lower parts of both islands, especially the South Island, inclusive of Otago, Southland, and the West Coast.
- New Zealand’s risk for ex-tropical cyclone activity is normal-to-elevated through April. These systems can cause flooding rainfall, strong winds, and coastal hazards.
- Soil moisture levels are about equally likely to be near normal or above normal in the north of the North Island and most likely to be near normal in all other regions. River flows are equally likely to be near normal or below normal in the west of the South Island, about equally likely to be near normal or above normal in the east of the North Island and north of the South Island, and most likely to be near normal in all other regions.
Regional predictions for December 2022 – February 2023
Northland, Auckland, Waikato, Bay of Plenty
The table below shows the probabilities (or percent chances) for each of three categories: above average, near average, and below average. In the absence of any forecast guidance there would be an equal likelihood (33% chance) of the outcome being in any one of the three categories. Forecast information from local and global guidance models is used to indicate the deviation from equal chance expected for the coming three-month period, with the following outcomes the most likely (but not certain) for this region:
- Temperatures are very likely to be above average (70% chance). More sub-tropical winds and marine heatwave conditions will result in high heat and humidity at times. There may be similarities with last summer.
- Rainfall totals are about equally likely to be near normal (40% chance) or above normal (35% chance). Low pressure systems are forecast to drop down into the region with some regularity, which may increase the risk for occasional heavy rainfall.
- Soil moisture levels are about equally likely to be near normal (45% chance) or above normal (40% chance each) and river flows are most likely to be near normal (45% chance).
The full probability breakdown is:
|
Temperature |
Rainfall |
Soil moisture |
River flows |
|
|
Above average |
70 |
35 |
40 |
35 |
|
Near average |
25 |
40 |
45 |
45 |
|
Below average |
05 |
25 |
15 |
20 |
Central North Island, Taranaki, Whanganui, Manawatu, Wellington
Probabilities are assigned in three categories: above average, near average, and below average.
- Temperatures are very likely to be above average (65% chance). More easterly-quarter winds and marine heatwave conditions will result in high heat and humidity at times.
- Rainfall totals are most likely to be near normal (45% chance). There is an elevated risk for dry spells as fewer westerly winds are expected. However, low pressure systems may bring occasional heavy rain from the north.
- Soil moisture levels and river flows are most likely to be near normal (50% chance).
The full probability breakdown is:
|
Temperature |
Rainfall |
Soil moisture |
River flows |
|
|
Above average |
65 |
25 |
10 |
35 |
|
Near average |
30 |
45 |
50 |
50 |
|
Below average |
05 |
30 |
40 |
15 |
Gisborne, Hawke’s Bay, Wairarapa
Probabilities are assigned in three categories: above average, near average, and below average.
- Temperatures are about equally likely to be near average (45% chance) or above average (50% chance). More onshore winds and marine heatwave conditions may lead to higher humidity levels, more cloud cover, and warmer overnight temperatures. Fewer northwesterly winds may limit the number of hot days (above 25˚C).
- Rainfall totals are about equally likely to be near normal (35% chance) or above normal (40% chance). More frequent onshore winds may lead to more wet days (more than 1 mm of rain). Occasional tropical moisture plumes are also possible, particularly for Gisborne and northern Hawke’s Bay.
- Soil moisture levels are most likely to be near normal (50% chance) and river flows are equally likely to be near normal or above normal (45% chance each).
The full probability breakdown is:
|
Temperature |
Rainfall |
Soil moisture |
River flows |
|
|
Above average |
50 |
40 |
25 |
45 |
|
Near average |
45 |
35 |
50 |
45 |
|
Below average |
05 |
25 |
25 |
10 |
Tasman, Nelson, Marlborough, Buller
Probabilities are assigned in three categories: above average, near average, and below average.
- Temperatures are most likely to be above average (55% chance). Marine heatwave conditions will result in high heat and humidity at times.
- Rainfall totals are most likely to be near normal (45% chance). There is an elevated risk for dry spells, particularly in Tasman, as fewer westerly winds are expected. However, low pressure systems may bring occasional heavy rain from the north.
- Soil moisture levels are most likely to be near normal (50% chance) and river flows are about equally likely to be near normal (45% chance) or above normal (40% chance).
The full probability breakdown is:
|
Temperature |
Rainfall |
Soil moisture |
River flows |
|
|
Above average |
55 |
30 |
25 |
40 |
|
Near average |
40 |
45 |
50 |
45 |
|
Below average |
05 |
25 |
25 |
15 |
West Coast, Alps and foothills, inland Otago, Southland
Probabilities are assigned in three categories: above average, near average, and below average.
- Temperatures are very likely to be above average (60% chance). More easterly-quarter winds and marine heatwave conditions will result in high heat and humidity at times.
- Rainfall totals are most likely to be below normal (50% chance). Due to La Niña, more frequent offshore winds will likely result in extended dry spells, elevating the risk for extreme dryness or drought like conditions. Low rainfall may also occur around the hydro lakes. However, the region should remain aware of the potential for a tropical moisture plume in January or February.
- Soil moisture levels are most likely to be near normal (45% chance) and river flows are equally likely to be near normal or below normal (40% chance each).
The full probability breakdown is:
|
Temperature |
Rainfall |
Soil moisture |
River flows |
|
|
Above average |
60 |
15 |
20 |
20 |
|
Near average |
35 |
35 |
45 |
40 |
|
Below average |
05 |
50 |
35 |
40 |
Coastal Canterbury, east Otago
Probabilities are assigned in three categories: above average, near average, and below average.
- Temperatures are equally likely to be near average or above average (45% chance each). Fewer northwesterly winds may lead to fewer hot days (above 25˚C), although more frequent onshore winds may contribute to more cloud cover, warmer overnight temperatures, and higher humidity. There may be similarities with last summer.
- Rainfall totals are equally likely to be near normal (40% chance) or above normal (35% chance). More frequent onshore winds may lead to more wet days (more than 1 mm of rain). Occasional tropical moisture plumes are also possible, particularly for North Canterbury. Conversely, nearby anticyclones could increase the risk for a dry spell or two during the season, especially in the south.
- Soil moisture levels and river flows are most likely to be near normal (45% chance).
The full probability breakdown is:
|
Temperature |
Rainfall |
Soil moisture |
River flows |
|
|
Above average |
45 |
35 |
35 |
20 |
|
Near average |
45 |
40 |
45 |
45 |
|
Below average |
10 |
25 |
20 |
35 |
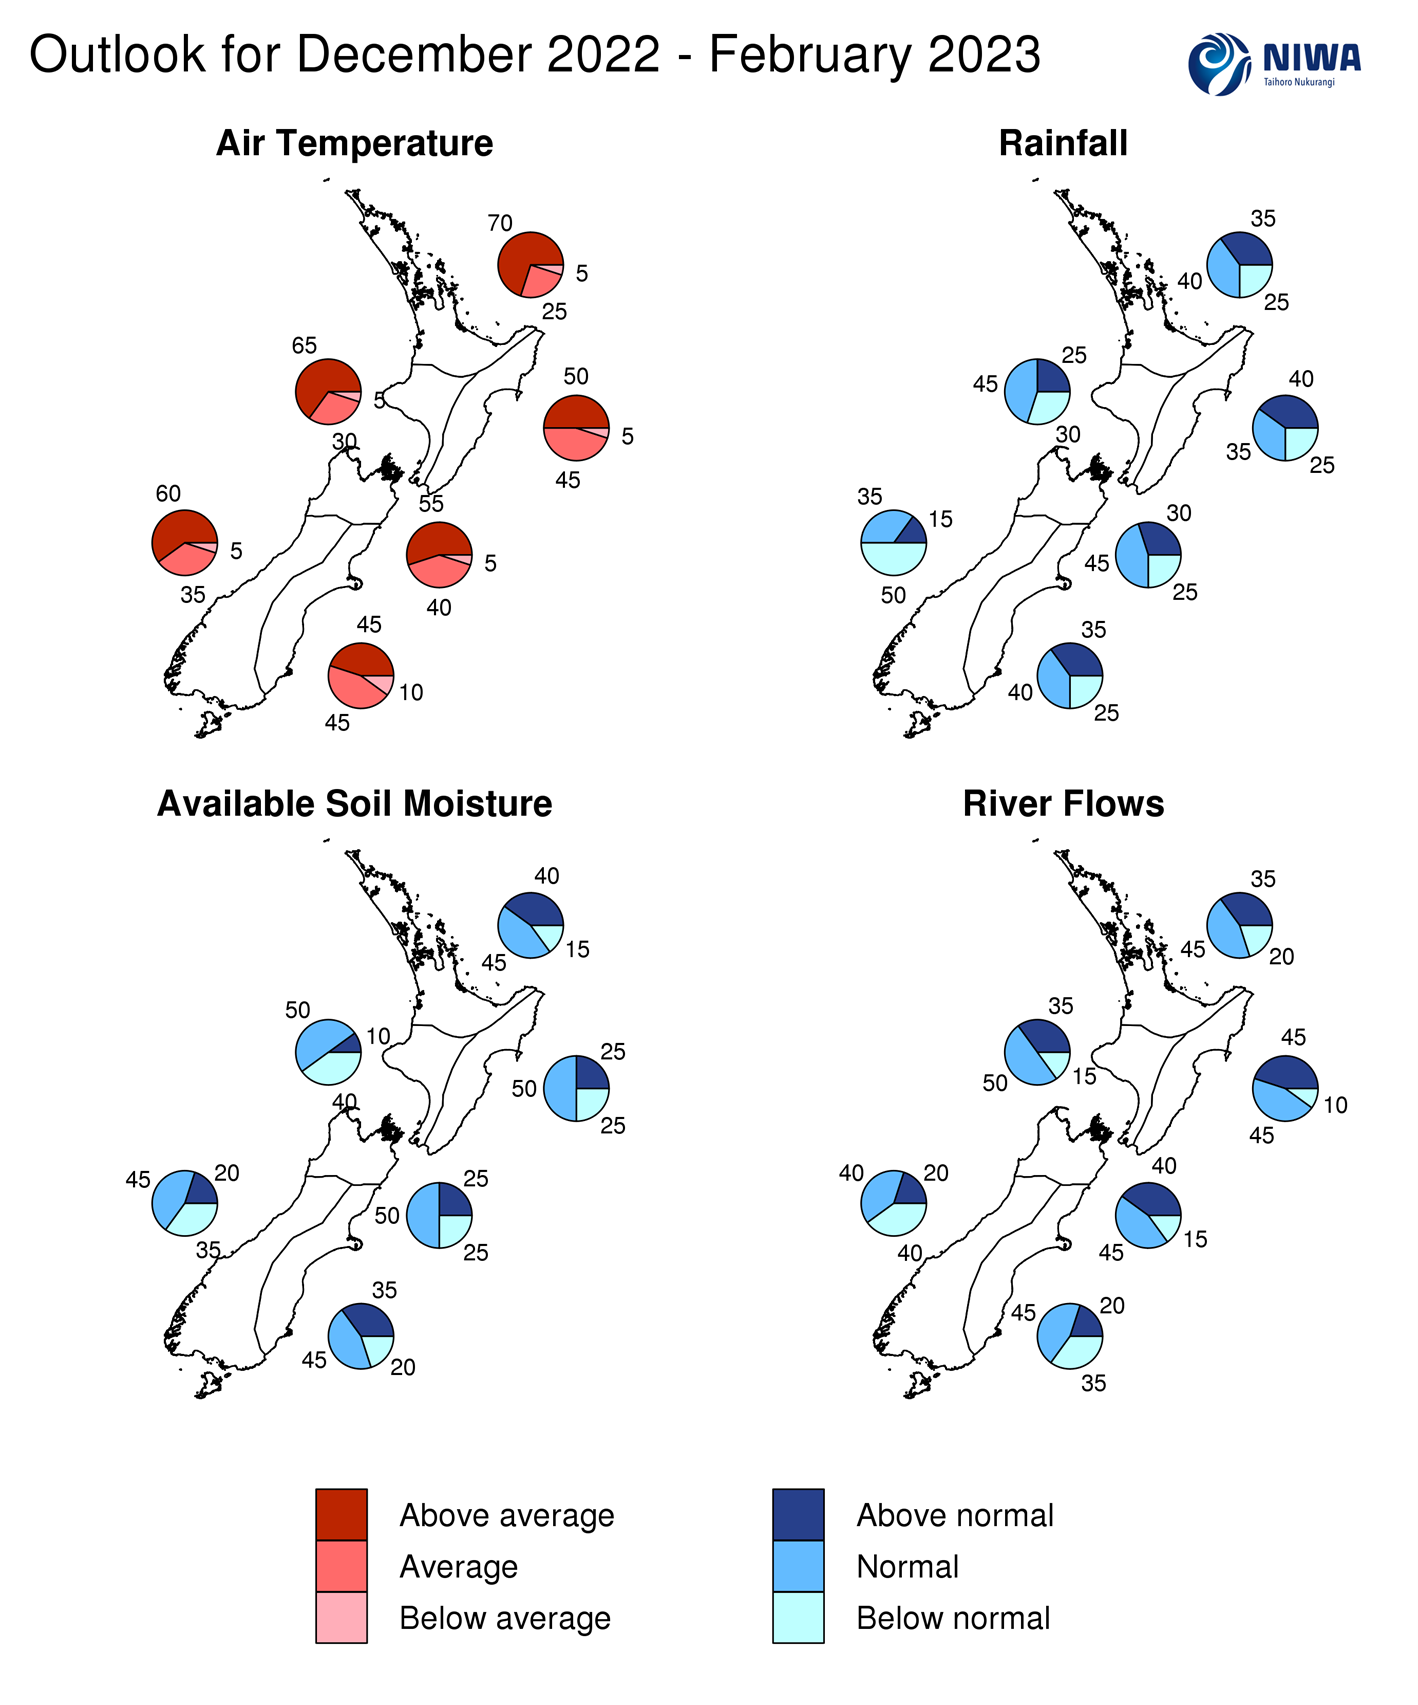
Graphical representation of the regional probabilities
Background
The NINO3.4 Index anomaly (in the central equatorial Pacific) over the last month (through 27 November) was -0.93˚C (climatology: 1991-2020), well within the La Niña range. Compared to the same time last year, conditions are cooler across the basin, particularly in the east.
The provisional November monthly Southern Oscillation Index (SOI) was 0.0 and +1.2 from September-November (climatology: 1991-2020), the latter within the La Niña range.
Trade winds were stronger than normal across the equatorial Pacific during November. This enabled the maintenance of oceanic La Niña conditions.
In the subsurface eastern equatorial Pacific, waters were 3˚C to 5˚C cooler than average at 50-100 m depth. This strong sub-surface expression will likely allow oceanic La Niña to continue through summer. At the end of November, the West Pacific Warm Pool began an eastward progression with warm anomalies occurring in the central Pacific at 150-200 m depth. A relaxation or reversal in trade winds during the coming months could allow the system to progress toward ENSO-neutral.
The odds for La Niña’s continuation during December-February is 75%. NIWA’s analysis indicates that a mature, moderate La Niña event is ongoing. An easing toward ENSO-neutral is likely from February-April 2023. Of note, the odds for El Niño have risen to over 40% for winter 2023. The last time El Niño conditions were observed during winter was 2015.
A sea surface temperature seesaw in the Indian Ocean, called the Indian Ocean Dipole (IOD), contributed to greater moisture availability in Australasia during November, although its signature eased late in the month. The IOD’s role in regional climate variability will wane during December.
Although La Niña’s influence on New Zealand’s summer climate will ebb and flow, it will be an important driver of climatic variability over summer. La Niña’s typical impacts for New Zealand include more easterly-quarter winds, warmer temperatures and lower rainfall about inland and western parts of both islands, and less frequent hot days in the east of both islands. In connection with La Niña, warmer than average seas in the Southwest Pacific are expected to fuel frequent low pressure systems, some of which will drop down into New Zealand, bringing the risk for occasional heavy rain and flooding, similar to what was experienced last summer.
The Madden-Julian Oscillation (MJO), a tropical pulse of rain and cloud, is another driver that will influence weather patterns around New Zealand this summer. At times, forcing from the MJO will work in tandem with La Niña (constructive interference) and other times it will work against it (destructive interference).
A period of constructive interference appears possible in mid-to-late December when MJO forcing is forecast over the Indian Ocean, Maritime Continent, and West Pacific. This may be associated with more high pressure near the country, especially the South Island, from mid-December into early January and could be associated with a dry spell.
Conversely, forcing may favour the western Indian Ocean for a time in January (phase 2), going against the grain of La Niña. This has historically been associated with more southerly flows, cooler temperatures, and wetter conditions in the eastern South Island.
The Southern Annular Mode (SAM) was positive during November, in association with lower than normal air pressure across Antarctica. The SAM will likely continue to spend more time in its positive phase over summer, similar to the last two summers which also featured La Niña conditions.
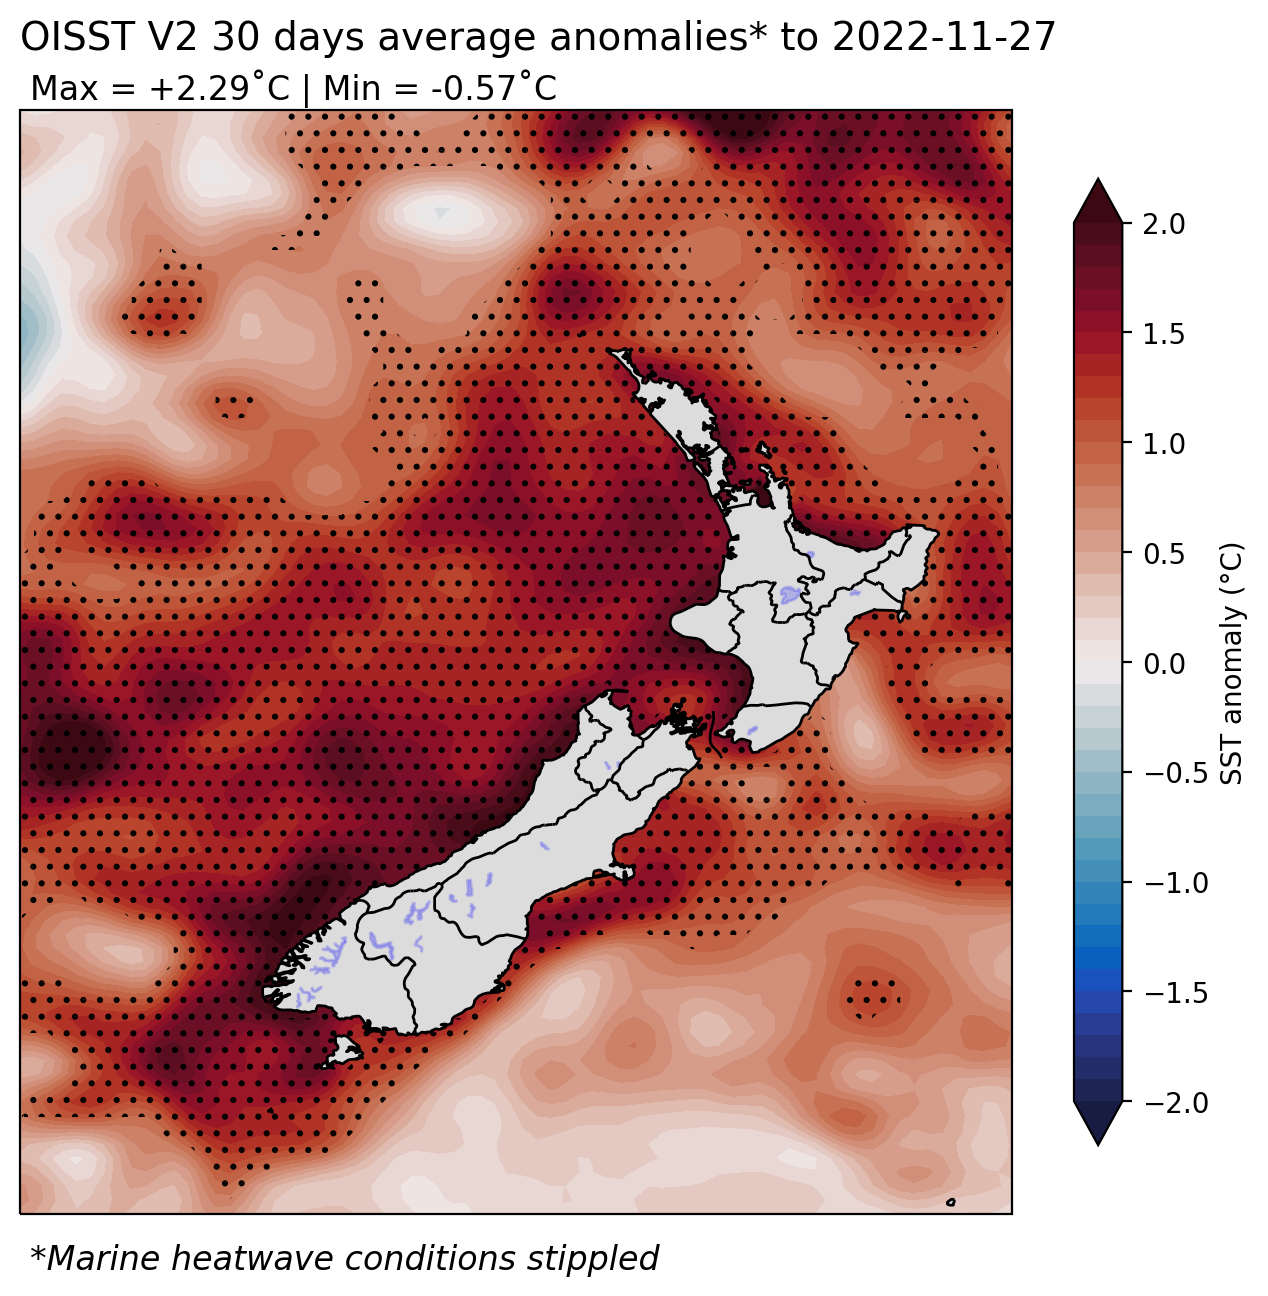
New Zealand’s coastal water temperatures became more unusually warm in all regions during November, in association with warm, north-east air flows and weaker wind speeds. Marine heatwave conditions (MHW) were occurring in some coastal waters offshore all regions. Compared to this time last year, seas are anywhere from 0.1˚C to 0.4˚C warmer. In fact, November 2022 seas were the warmest on record (since 1981) in all regions except the east of the North Island and east of the South Island, where it was warmer during November 2005 and 2013, respectively. The first half of December looks to have variable temperatures, which likely means that the MHW will not intensify significantly. The potential for a warming trend during the 2nd half of the month could enable the MHW to strengthen. The NIWA Sea Surface Temperature Update suggests that MHW conditions are likely to last through summer and possibly into autumn. Given the high-impact nature of recent summer marine heatwaves, the marine sector should monitor this situation closely, particularly as it has a higher starting point than 2021 and 2017, two of New Zealand’s most severe MHWs.
NZ 30-day coastal SST anomalies (to 27 November)
|
North NI |
+1.49˚C |
|
West NI |
+1.73˚C |
|
East NI |
+1.11˚C |
|
North SI |
+1.57˚C |
|
West SI |
+1.74˚C |
|
East SI |
+1.32˚C |
Forecast Confidence
Temperature
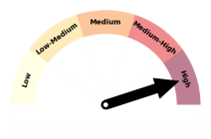
|
Forecast confidence for temperatures is high. The development of widespread marine heatwave conditions during November is expected to have a strong influence on land temperatures this summer. However, more easterly air flows and fewer westerlies will likely reduce the number of hot days in the east. |
Rainfall
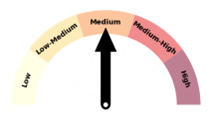
|
Forecast confidence for rainfall is medium. There is strong cross-model agreement on lower than normal air pressure near and north of New Zealand, increasing the odds for wetter than normal conditions in the north and east of the North Island. A propensity for more easterly winds is expected to reduce the frequency of rain events about the inland and western part of both islands, but especially the South Island, increasing the odds for dryness there. |