Outlook Summary
- The atmospheric circulation around New Zealand is forecast to be characterised by higher pressure than normal extending from the Chatham Islands to the Australian Bight. Over New Zealand, the circulation will be characterised by westerly quarter flow anomalies and mixed flows.
- Mean summer temperatures are about equally likely to be near or above average.
- Near normal summer rainfall is likely for most regions; however, the north of the North Island has about equal chances for below normal or near normal rainfall and the west of the South Island has about equal chances for above normal or near normal rainfall.
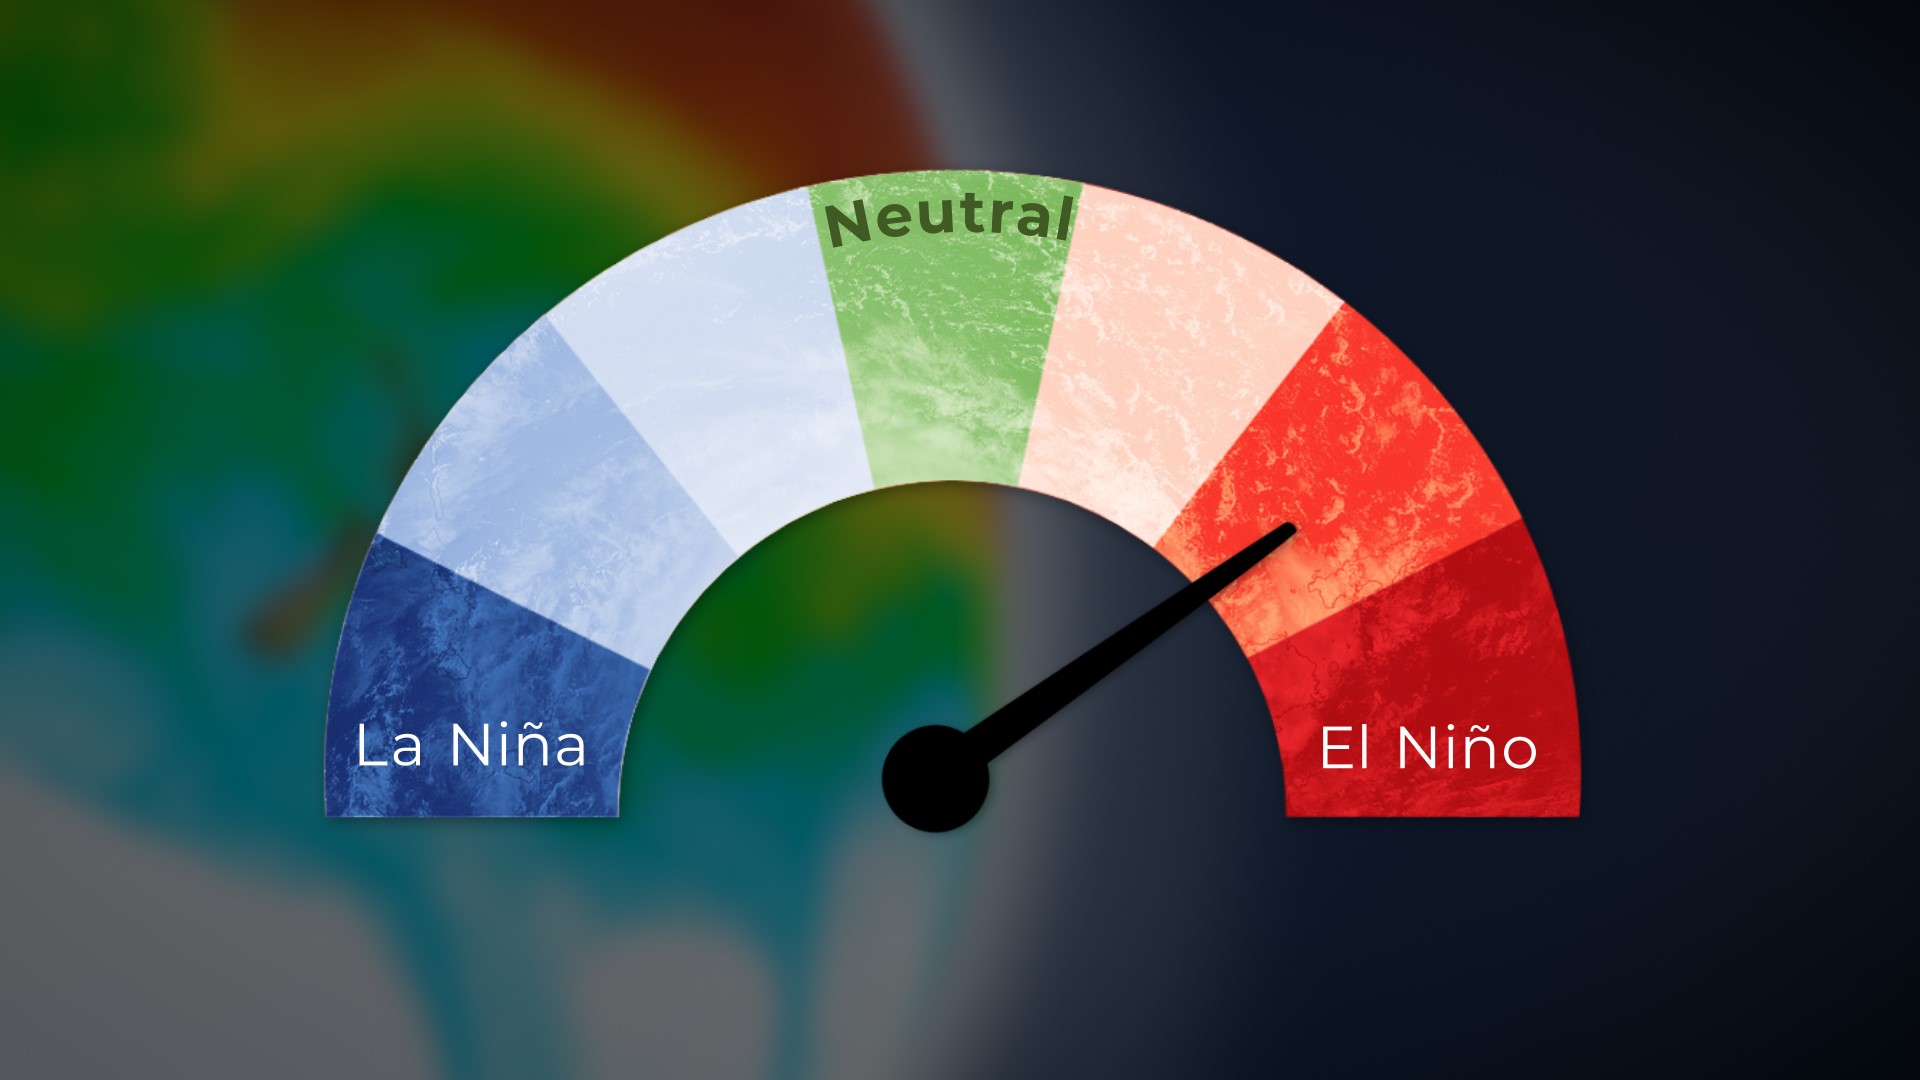
- The tropical Pacific Ocean is exhibiting weak El Niño conditions, although the atmosphere has failed to follow suit – meaning the ocean and atmosphere are not coupled.
- An El Niño event is occurring when the tropical Pacific Ocean and the overlying atmosphere behave in unison and reinforce one another.
- The prospect of the ocean and atmosphere failing to fully couple in the next three months may increase variability this summer (e.g. not persistently warm like summer 2017-18 and more changeable air flow patterns).
- Above average or near average sea surface temperatures (SSTs) are expected in New Zealand coastal waters during the next three months. Coastal SSTs are currently above average.
- For the current tropical cyclone season (November 2018 to April 2019), NIWA’s Southwest Pacific Tropical Cyclone Outlook indicates that the risk for New Zealand is near normal. On average, at least one ex-tropical cyclone passes within 550km of New Zealand each year. Significant rainfall, damaging winds, and coastal damage can occur during these events.
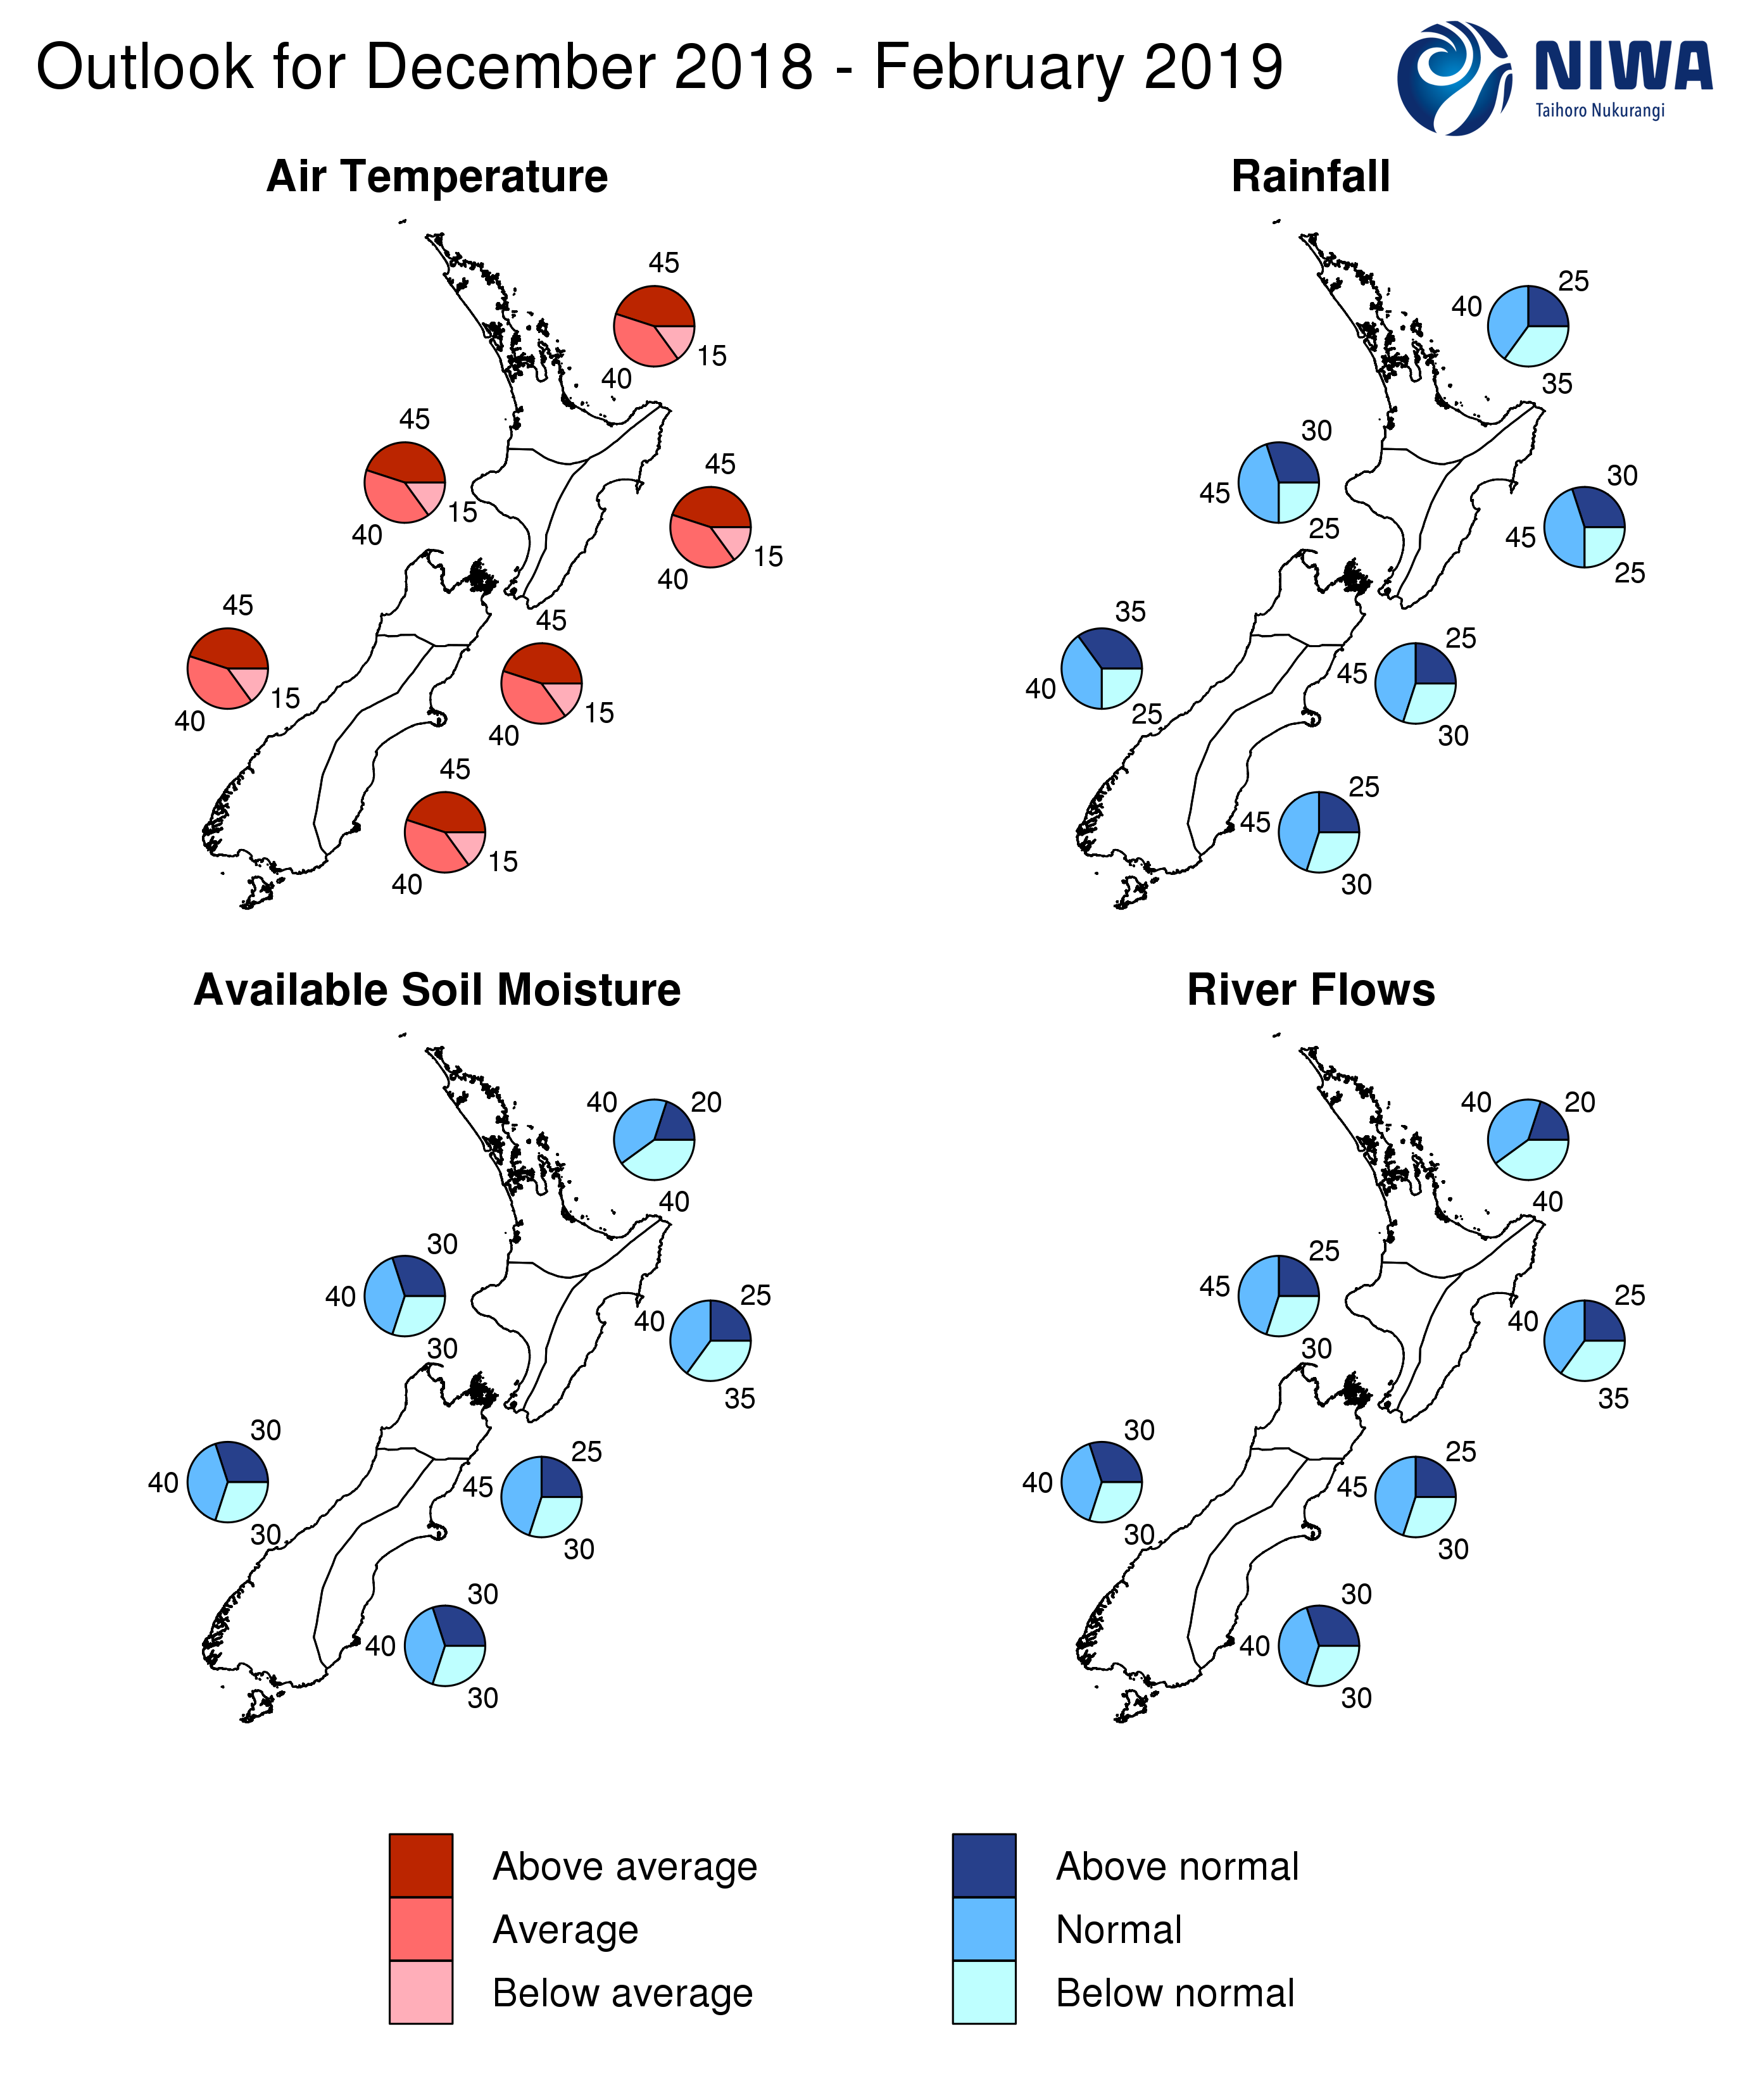
December 2018 – February 2019 temperatures are forecast to be above average (45% chance) or near average (40% chance) for all regions of New Zealand.
December 2018 – February 2019 rainfall totals are forecast to be near normal (40% chance) or below normal (35% chance) for the north of the North Island and near normal (40% chance) or above normal (35% chance) for the west of the South Island. Near normal rainfall (45% chance) is most likely for all remaining regions of New Zealand.
December 2018 – February 2018 soil moisture levels and river flows are about equally likely to be near normal (40% chance) or below normal (35–40% chance) for the east and north of the North Island. Near normal (40–45% chance) soil moisture and river flows are expected for all other regions of New Zealand.
Regional predictions for the December 2018 – February 2019 season
Northland, Auckland, Waikato, Bay of Plenty
The table below shows the probabilities (or percent chances) for each of three categories: above average, near average, and below average. In the absence of any forecast guidance there would be an equal likelihood (33% chance) of the outcome being in any one of the three categories. Forecast information from local and global guidance models is used to indicate the deviation from equal chance expected for the coming three-month period, with the following outcomes the most likely (but not certain) for this region:
- Temperatures are about equally likely to be above average (45% chance) or near average (40% chance).
- Rainfall totals are about equally likely to be near normal (40% chance) or below normal (35% chance).
- Soil moisture levels and river flows are equally likely to be near normal (40% chance) or below normal (40% chance).
The full probability breakdown is:
|
Temperature |
Rainfall |
Soil moisture |
River flows |
|
|
Above average |
45 |
25 |
20 |
20 |
|
Near average |
40 |
40 |
40 |
40 |
|
Below average |
15 |
35 |
40 |
40 |
Central North Island, Taranaki, Whanganui, Manawatu, Wellington
Probabilities are assigned in three categories: above average, near average, and below average.
- Temperatures are about equally likely to be above average (45% chance) or near average (40% chance).
- Rainfall totals are mostly likely to be in the near normal range (45% chance).
- Soil moisture levels and river flows are most likely to be in the near normal range (40-45% chance).
The full probability breakdown is:
|
Temperature |
Rainfall |
Soil moisture |
River flows |
|
|
Above average |
45 |
30 |
30 |
25 |
|
Near average |
40 |
45 |
40 |
45 |
|
Below average |
15 |
25 |
30 |
30 |
Gisborne, Hawke’s Bay, Wairarapa
Probabilities are assigned in three categories: above average, near average, and below average.
- Temperatures are about equally likely to be above average (45% chance) or near average (40% chance).
- Rainfall totals are mostly likely to be in the near normal range (45% chance).
- Soil moisture levels and river flows are about equally likely to be near normal (40% chance) or below normal (35% chance).
The full probability breakdown is:
|
Temperature |
Rainfall |
Soil moisture |
River flows |
|
|
Above average |
45 |
30 |
25 |
25 |
|
Near average |
40 |
45 |
40 |
40 |
|
Below average |
15 |
25 |
35 |
35 |
Tasman, Nelson, Marlborough, Buller
Probabilities are assigned in three categories: above average, near average, and below average.
- Temperatures are about equally likely to be above average (45% chance) or near average (40% chance).
- Rainfall totals, soil moisture levels and river flows are all mostly likely to be in the near normal range (45% chance).
The full probability breakdown is:
|
Temperature |
Rainfall |
Soil moisture |
River flows |
|
|
Above average |
45 |
25 |
25 |
25 |
|
Near average |
40 |
45 |
45 |
45 |
|
Below average |
15 |
30 |
30 |
30 |
West Coast, Alps and foothills, inland Otago, Southland
Probabilities are assigned in three categories: above average, near average, and below average.
- Temperatures are about equally likely to be above average (45% chance) or near average (40% chance).
- Rainfall totals are about equally likely to be near normal (40% chance) or above normal (35% chance).
- Soil moisture levels and river flows are most likely to be in the near normal range (40% chance).
The full probability breakdown is:
|
Temperature |
Rainfall |
Soil moisture |
River flows |
|
|
Above average |
45 |
35 |
30 |
30 |
|
Near average |
40 |
40 |
40 |
40 |
|
Below average |
15 |
25 |
30 |
30 |
Coastal Canterbury, east Otago
Probabilities are assigned in three categories: above average, near average, and below average.
- Temperatures are about equally likely to be above average (45% chance) or near average (40% chance).
- Rainfall totals, soil moisture levels and river flows are all mostly likely to be in the near normal range (40-45% chance).
The full probability breakdown is:
|
Temperature |
Rainfall |
Soil moisture |
River flows |
|
|
Above average |
45 |
25 |
30 |
30 |
|
Near average |
40 |
45 |
40 |
40 |
|
Below average |
15 |
30 |
30 |
30 |
Graphical representation of the regional probabilities
Background
Sea surface temperatures (SSTs) across the east-central tropical Pacific have reached weak El Niño conditions. Over the past month, SSTs in the central Pacific (NINO3.4 Index) have continued to warm, increasing to an anomaly of +0.9oC. This marks the third consecutive month SST anomalies in the central Pacific have exceeded 0.7oC, which meets NIWA’S technical oceanic definition for El Niño.
However, the atmosphere has yet to respond to this additional warmth and become truly coupled with the ocean in a manner typically associated with an El Niño event. One reflection of this is the Southern Oscillation Index (SOI), which was at –0.2 for November, i.e. in the neutral range.
An El Niño event is considered to have formally occurred when the tropical Pacific Ocean and the overlying atmosphere act in concert and reinforce each other, operating as a key driver of global weather and climate patterns.
Trade winds, until recently, have been generally near or weaker than average for the month of November. However, a significant Westerly Wind Burst (WWB) between the Date Line and 120oW is expected through to the first week of December. This WWB will likely result in an additional downwelling Kelvin wave, which will may tip the atmosphere toward El Niño over the coming weeks in what would become an unusually late onset.
It is possible that over the coming months the ocean and atmosphere do not act in unison or at least are slow to do so, i.e. the ocean suggests El Niño but the atmosphere does not. In this case, the impact on New Zealand’s weather patterns may differ from what is typically experienced during a conventional El Niño event.
The consensus from international models is for the tropical Pacific to transition towards El Niño over the next three-month period (94% chance over December 2018 – February 2019). The probability for El Niño remains high through autumn 2019, with an 85% chance for occurrence in the March – May 2019 period. In fact, the probability of El Nino remains unusually elevated (66% chance) through to the next Southern Hemisphere winter season (signalling the possibility of a protracted El Niño event extending over 2 years).
It should be noted that SST anomalies are used to articulate the probability of an El Niño occurring, and that it is not the prospect for a fully coupled ocean-atmosphere event. Essentially, it is possible for the ocean to exhibit El Niño, and therefore the forecast models would be accurate. However, if the atmosphere is not coupled with the ocean, e.g. the atmosphere does not reflect El Niño, then a formal acknowledgment of El Niño will not occur.
New Zealand coastal SSTs remained above average during November. The most anomalous SSTs were found near the northern South Island (+1.05oC). The expectation is for average or above average SSTs during the December – February period, although above average SSTs are likely for the month of December.
Download:
Seasonal climate outlook - December 2018 - February 2019 [600KB PDF]
Contact:
Chris Brandolino, Principal Scientist – Forecasting, NIWA National Climate Centre Tel (09) 375 6335, Mobile (027) 886 0014
Dr Brett Mullan, Principal Scientist, NIWA National Climate Centre Tel (04) 386 0508, Mobile (027) 294 1169