Outlook Summary
- Very strong trade winds in the equatorial Pacific led to a cooling of sub-surface ocean temperatures during July. This will very likely lead to a re-strengthening of La Niña conditions in the coming months. See the background for more info.
- The potential for more anticyclones near the country, owing to La Niña, may lead to warmer temperatures, sunshine, and fewer westerly winds than normal during spring. This may be associated with an increase in dry spells during the period, particularly in the west of both islands.
- This pattern could limit the number of southerly fronts but also allow low pressure systems to track towards the country from the northwest from time to time – such systems caused heavy rainfall and flooding during July.
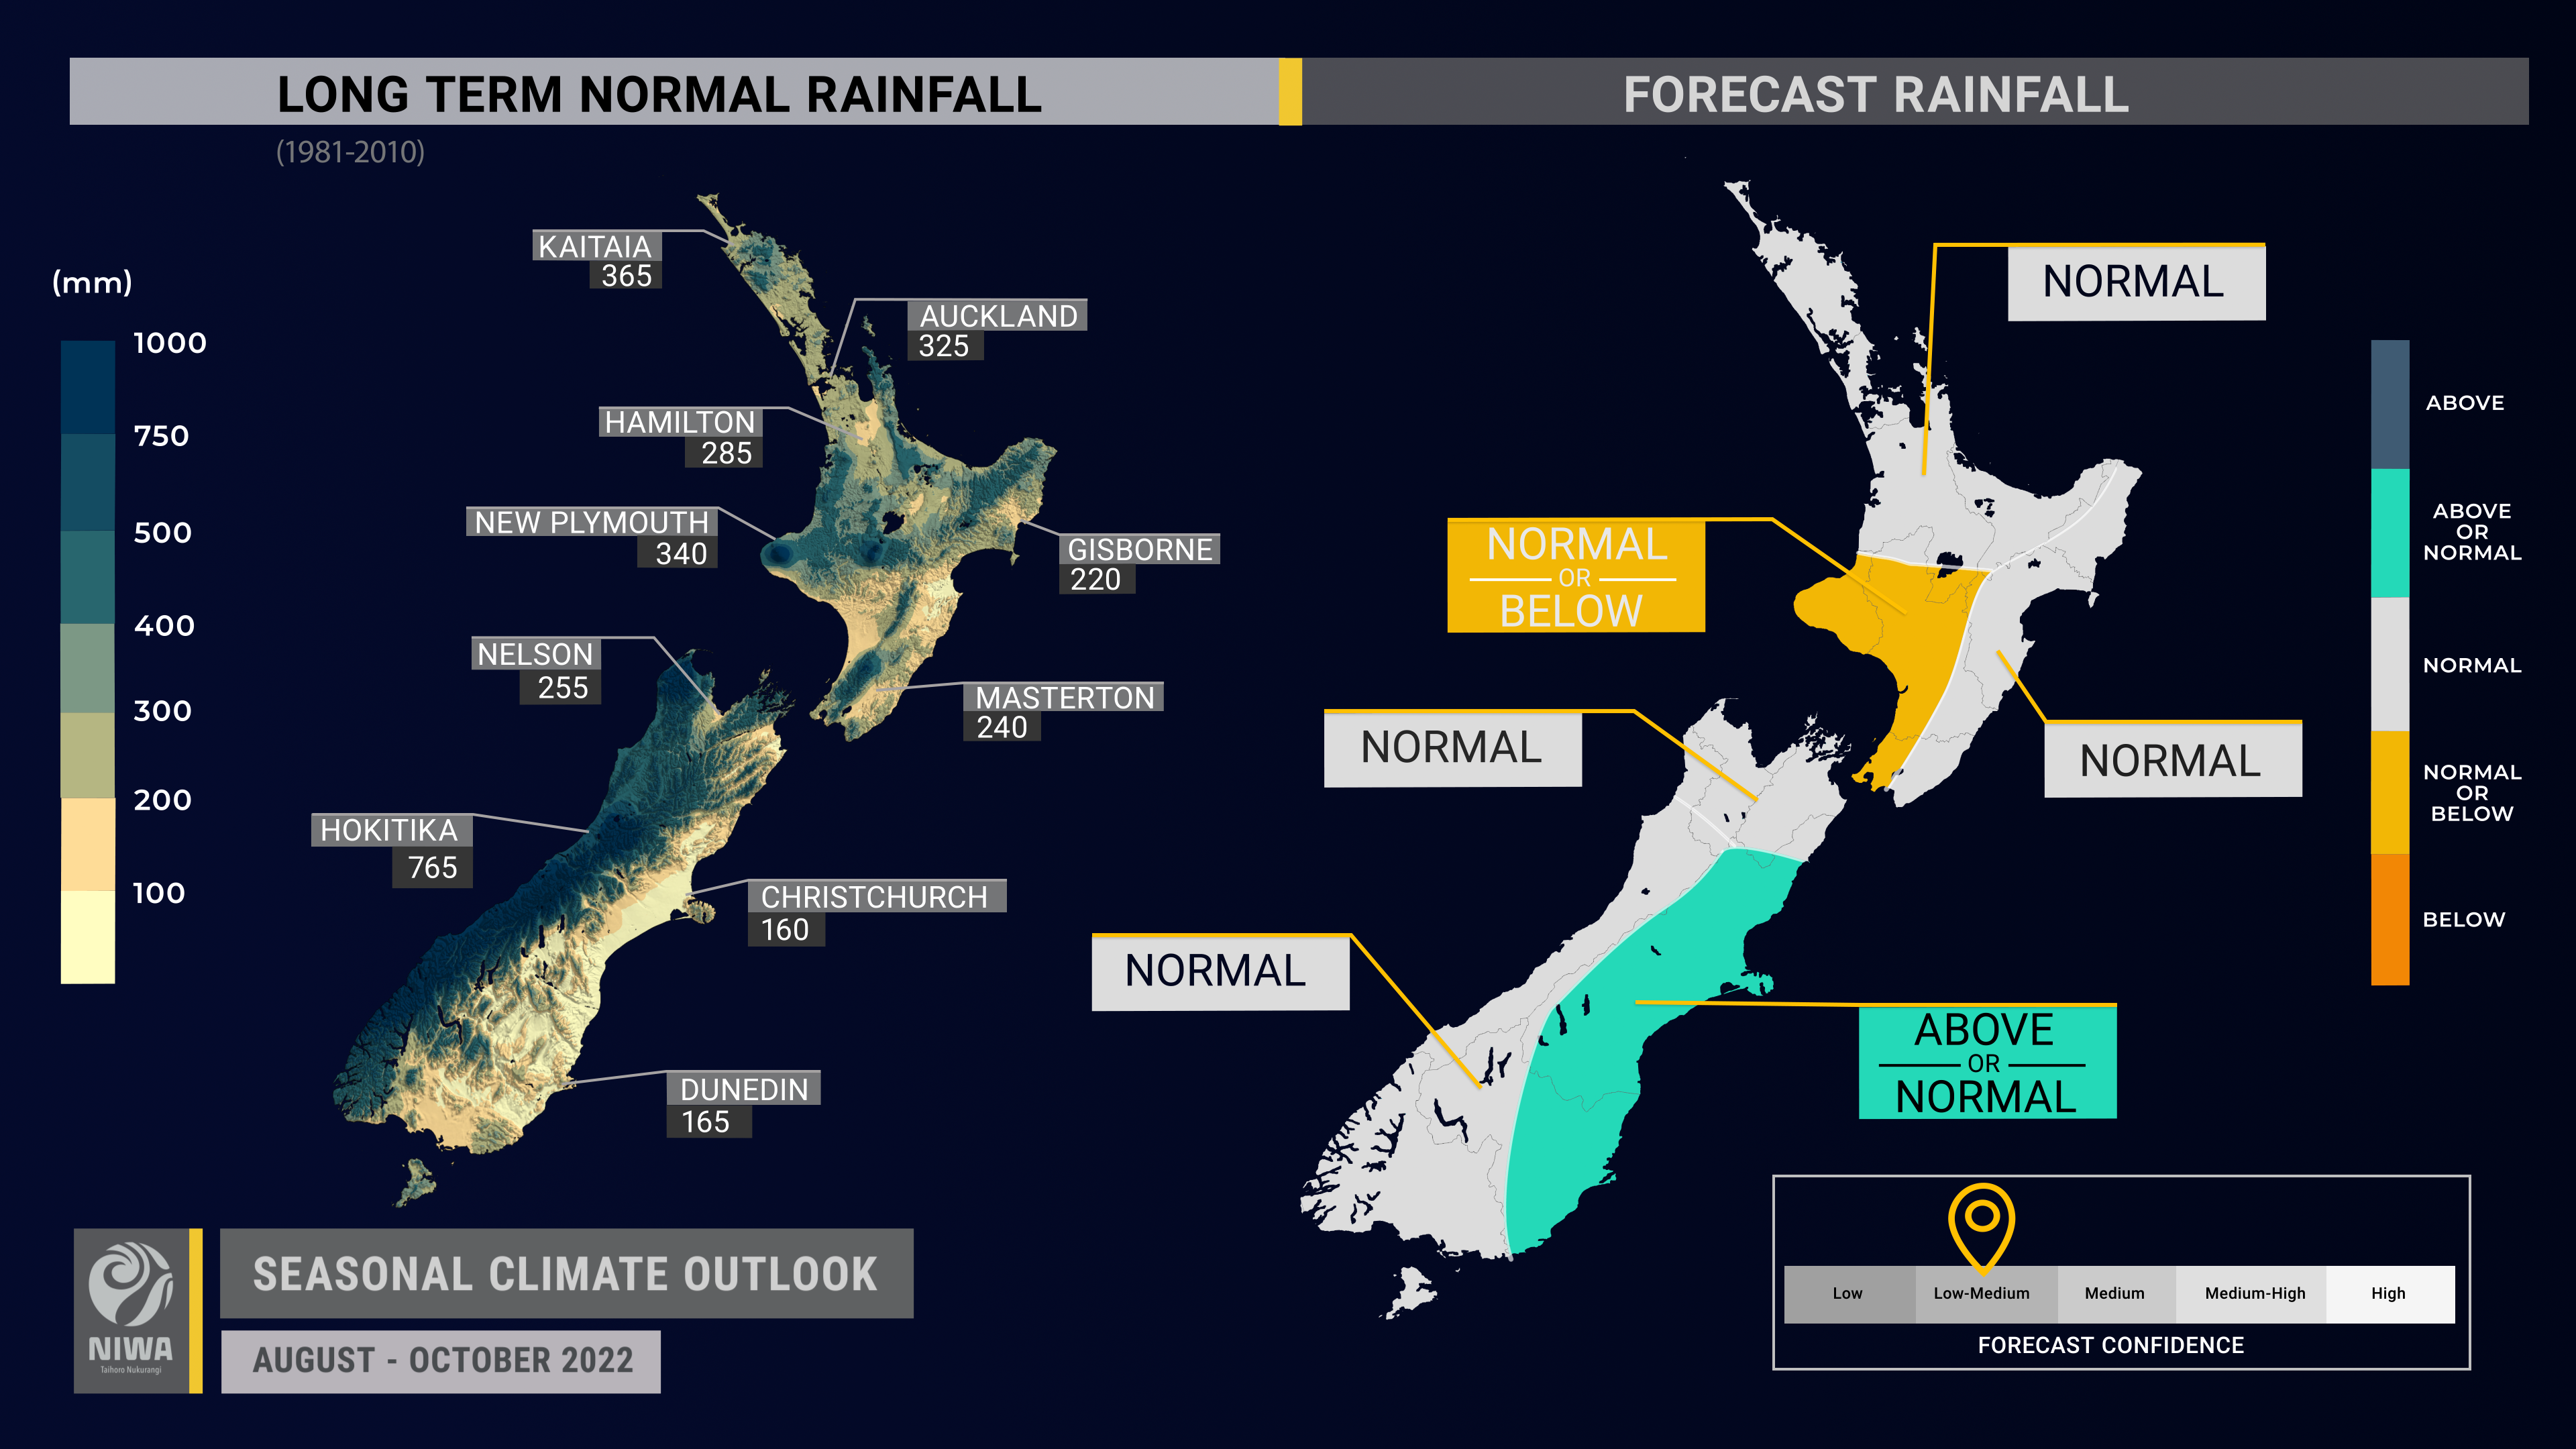
- Rainfall is about equally likely to be near normal or below normal in the west of the North Island, about equally likely to be near normal or above normal in the east of the South Island, and most likely to be near normal in all other regions. Overall, this is a shift towards drier conditions relative to previous outlooks.
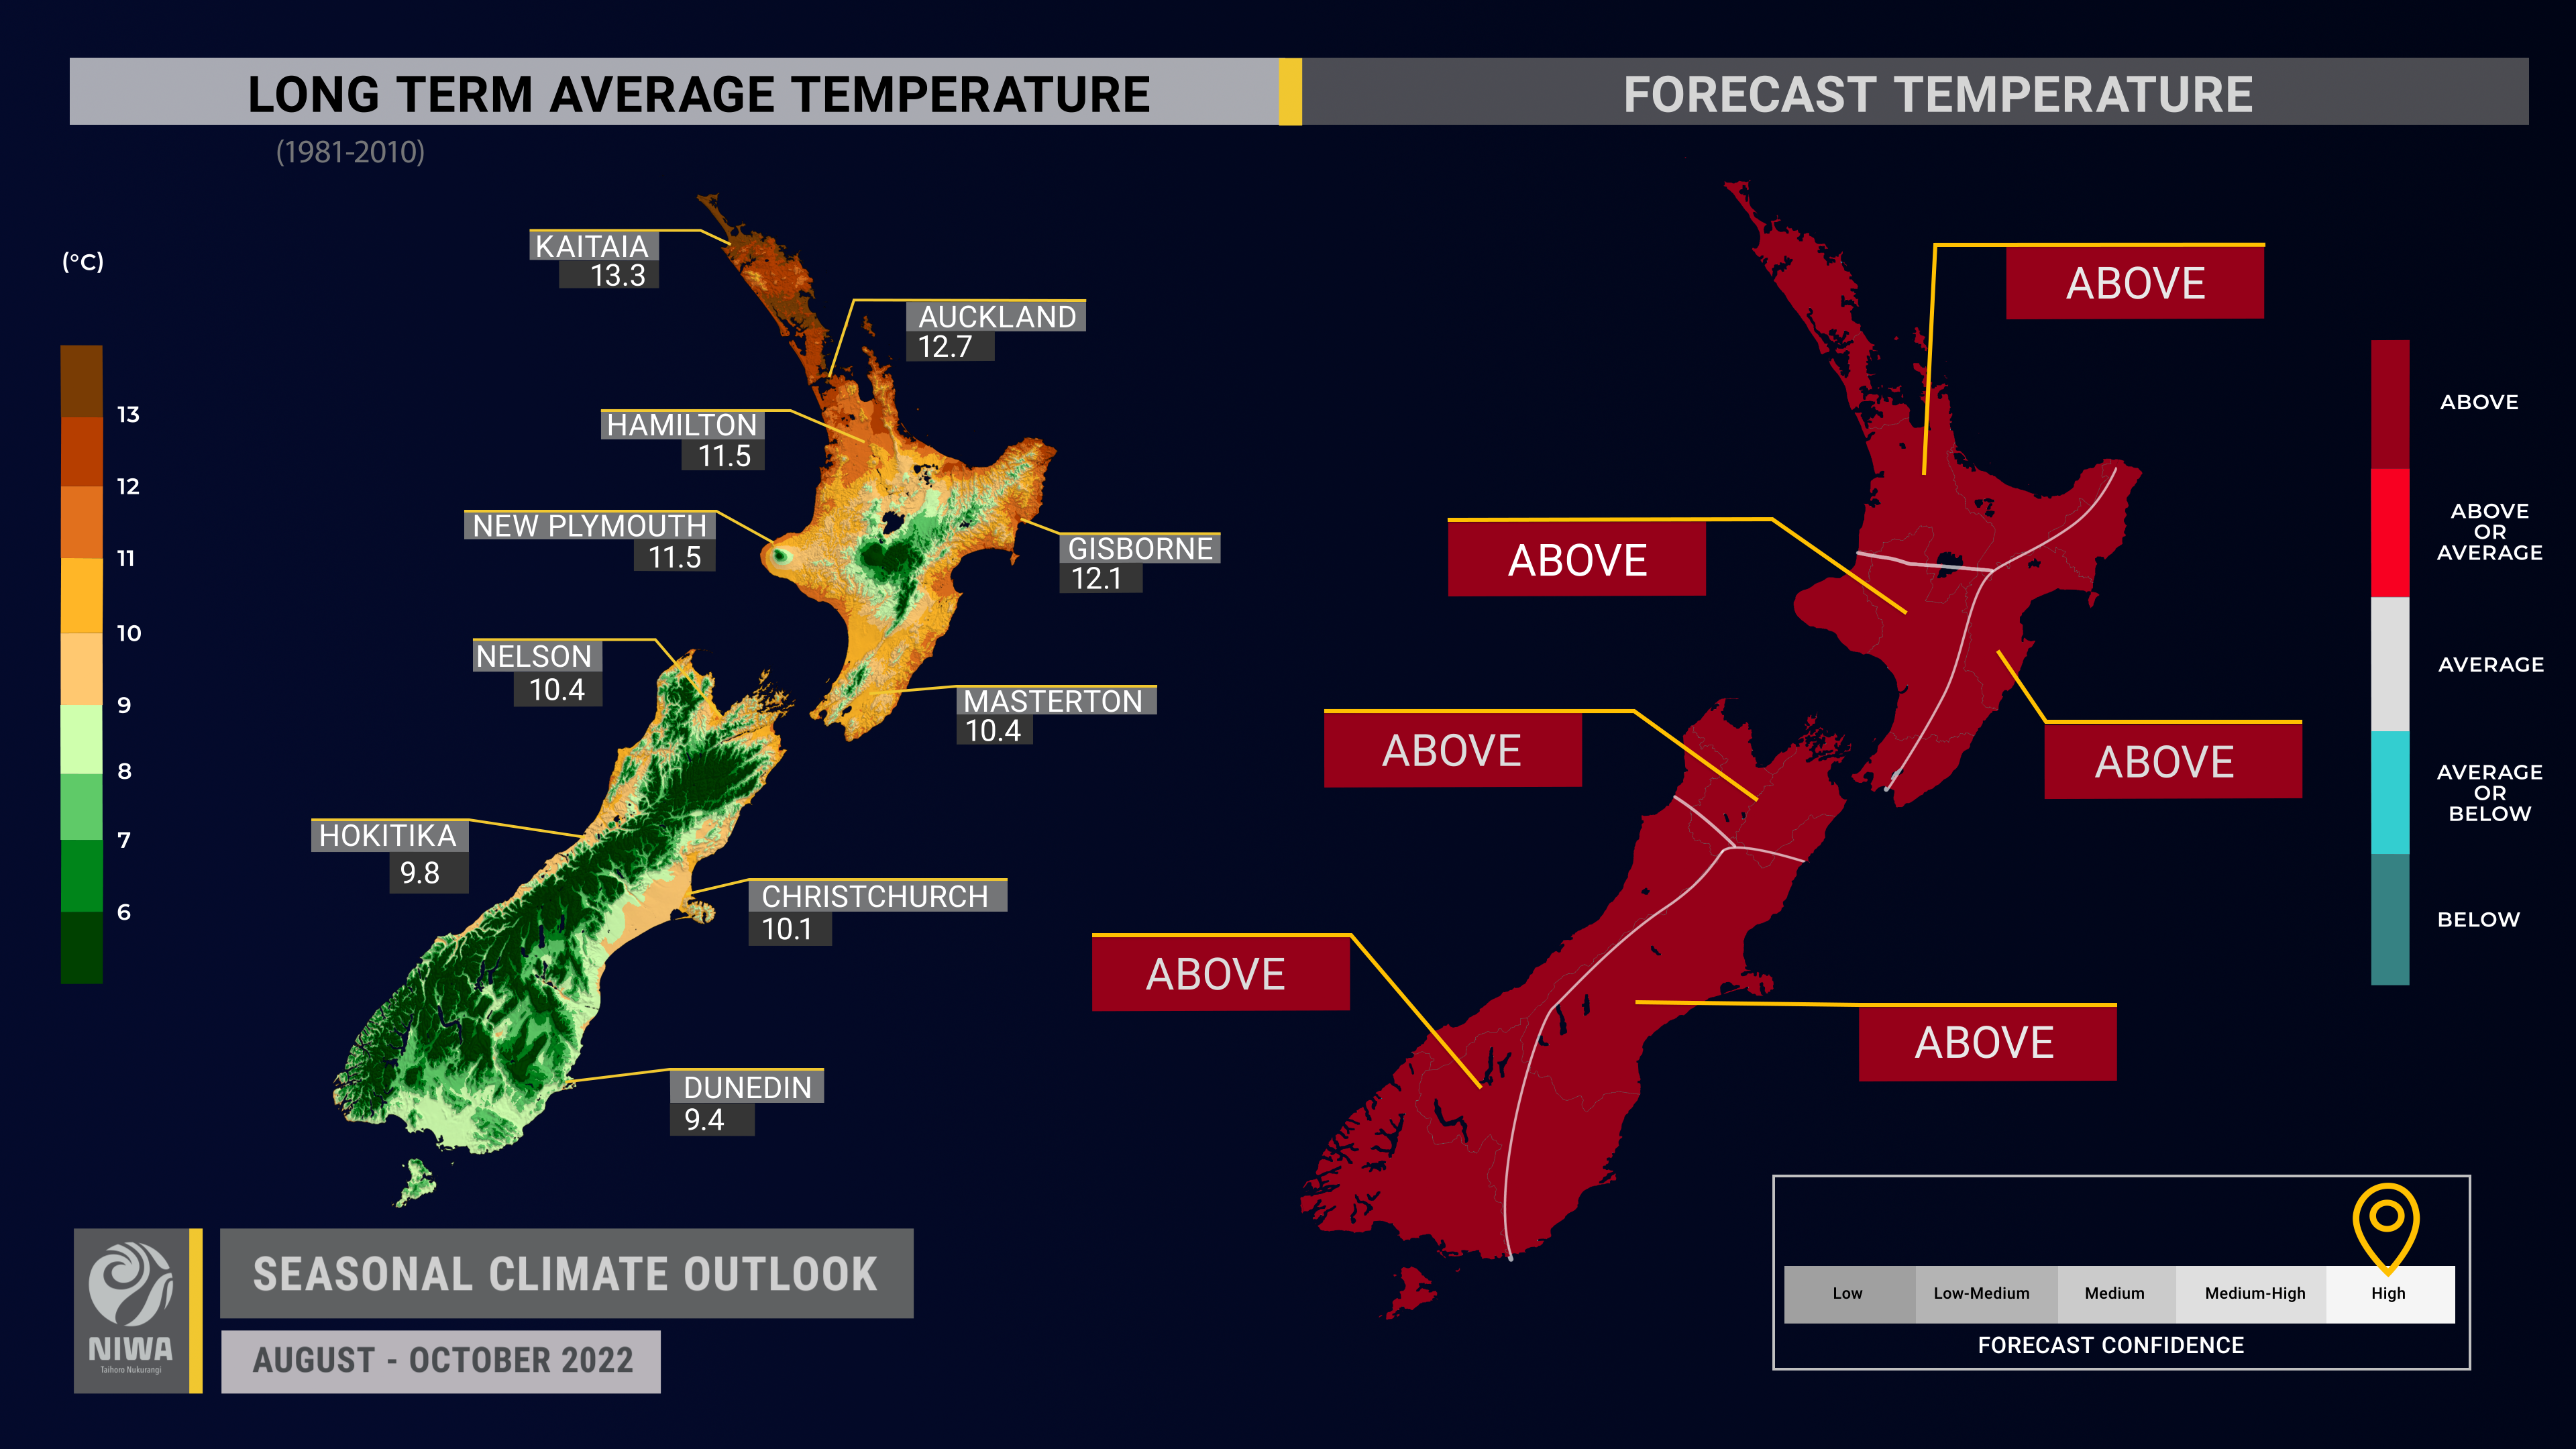
- Temperatures are very likely to be warmer than average in the north and west of both islands and most likely to be warmer than average in the east of both islands. Warmer than average sea temperatures are expected to continue to buffer the country from long-duration cold.
- Around New Zealand, sea surface temperatures (SSTs) ranged from 0.5˚C to 1.3˚C above average during July, a decrease compared to June. SSTs are forecast to remain above average into spring, which will have an upward influence on air temperatures.
- Soil moisture levels and river flows currently range from normal to well above normal across the country due to heavy July rainfall. This has contributed to substantial groundwater recharge and a replenishment of water storages. The expectation over the next three months is for a return to near normal soil moisture and river flow conditions across the country.
Regional predictions for August – October 2022
Northland, Auckland, Waikato, Bay of Plenty
The table below shows the probabilities (or percent chances) for each of three categories: above average, near average, and below average. In the absence of any forecast guidance there would be an equal likelihood (33% chance) of the outcome being in any one of the three categories. Forecast information from local and global guidance models is used to indicate the deviation from equal chance expected for the coming three-month period, with the following outcomes the most likely (but not certain) for this region:
- Temperatures are very likely to be above average (65% chance). More northeasterly winds may transport unseasonable warmth and humidity toward the region from time to time.
- Rainfall totals are most likely to be near normal (45% chance). Sub-tropical low pressure systems may occasionally track toward the region, increasing the risk for heavy rain. Conversely, more easterly winds could lead to dry spells, particularly in the south-west of the region, such as Waikato.
- Soil moisture levels and river flows are most likely to be near normal (45% chance).
The full probability breakdown is:
|
Temperature |
Rainfall |
Soil moisture |
River flows |
|
|
Above average |
65 |
25 |
35 |
35 |
|
Near average |
30 |
45 |
45 |
45 |
|
Below average |
05 |
30 |
20 |
20 |
Central North Island, Taranaki, Whanganui, Manawatu, Wellington
Probabilities are assigned in three categories: above average, near average, and below average.
- Temperatures are very likely to be above average (65% chance). More northeasterly winds may cause periods of increased sunshine and warmer temperatures.
- Rainfall totals are about equally likely to be near normal (40% chance) or below normal (35% chance). Fewer spring westerlies may increase the risk for dry spells.
- Soil moisture levels and river flows are most likely to be near normal (45% chance).
The full probability breakdown is:
|
Temperature |
Rainfall |
Soil moisture |
River flows |
|
|
Above average |
65 |
25 |
30 |
30 |
|
Near average |
30 |
40 |
45 |
45 |
|
Below average |
05 |
35 |
25 |
25 |
Gisborne, Hawke’s Bay, Wairarapa
Probabilities are assigned in three categories: above average, near average, and below average.
- Temperatures are most likely to be above average (55% chance). More northeasterly winds may lead to higher humidity levels, more cloud cover, and warmer overnight temperatures.
- Rainfall totals are most likely to be near normal (45% chance). The potential for more frequent onshore winds during spring could lead to more wet days. Sub-tropical low pressure systems may occasionally track toward the region, increasing the risk for heavy rain, particularly in the northern part of the region, such as Gisborne.
- Soil moisture levels and river flows are most likely to be near normal (45-50% chance).
The full probability breakdown is:
|
Temperature |
Rainfall |
Soil moisture |
River flows |
|
|
Above average |
55 |
30 |
30 |
30 |
|
Near average |
40 |
45 |
50 |
45 |
|
Below average |
05 |
25 |
20 |
25 |
Tasman, Nelson, Marlborough, Buller
Probabilities are assigned in three categories: above average, near average, and below average.
- Temperatures are very likely to be above average (60% chance). More northeasterly winds may transport sub-tropical warmth toward the region from time to time.
- Rainfall is most likely to be near normal (45% chance). Fewer westerly winds during spring may lead to dry spells, particularly in western parts of the region like Tasman and Buller.
- Soil moisture levels and river flows are most likely to be near normal (45% chance).
The full probability breakdown is:
|
Temperature |
Rainfall |
Soil moisture |
River flows |
|
|
Above average |
60 |
25 |
30 |
30 |
|
Near average |
35 |
45 |
45 |
45 |
|
Below average |
05 |
30 |
25 |
25 |
West Coast, Alps and foothills, inland Otago, Southland
Probabilities are assigned in three categories: above average, near average, and below average.
- Temperatures are very likely to be above average (60% chance). More northeasterly winds may cause periods of increased sunshine and warmer temperatures.
- Rainfall totals are most likely to be near normal (45% chance). Several heavy fronts are likely during the first week of August. Fewer westerly winds during spring may lead to dry spells.
- Soil moisture levels and river flows are most likely to be near normal (45% chance).
The full probability breakdown is:
|
Temperature |
Rainfall |
Soil moisture |
River flows |
|
|
Above average |
60 |
25 |
35 |
35 |
|
Near average |
35 |
45 |
45 |
45 |
|
Below average |
05 |
30 |
20 |
20 |
Coastal Canterbury, east Otago
Probabilities are assigned in three categories: above average, near average, and below average.
- Temperatures are most likely to be above average (55% chance). More northeasterly winds may lead to more cloud cover and warmer overnight temperatures.
- Rainfall totals are about equally likely to be near normal (40% chance) or above normal (35% chance). Several heavy fronts are likely in the High Country during the first week of August. The potential for more frequent onshore winds during spring could lead to more wet days.
- Soil moisture levels and river flows are most likely to be near normal (45% chance).
The full probability breakdown is:
|
Temperature |
Rainfall |
Soil moisture |
River flows |
|
|
Above average |
55 |
35 |
35 |
35 |
|
Near average |
40 |
40 |
45 |
45 |
|
Below average |
05 |
25 |
20 |
20 |
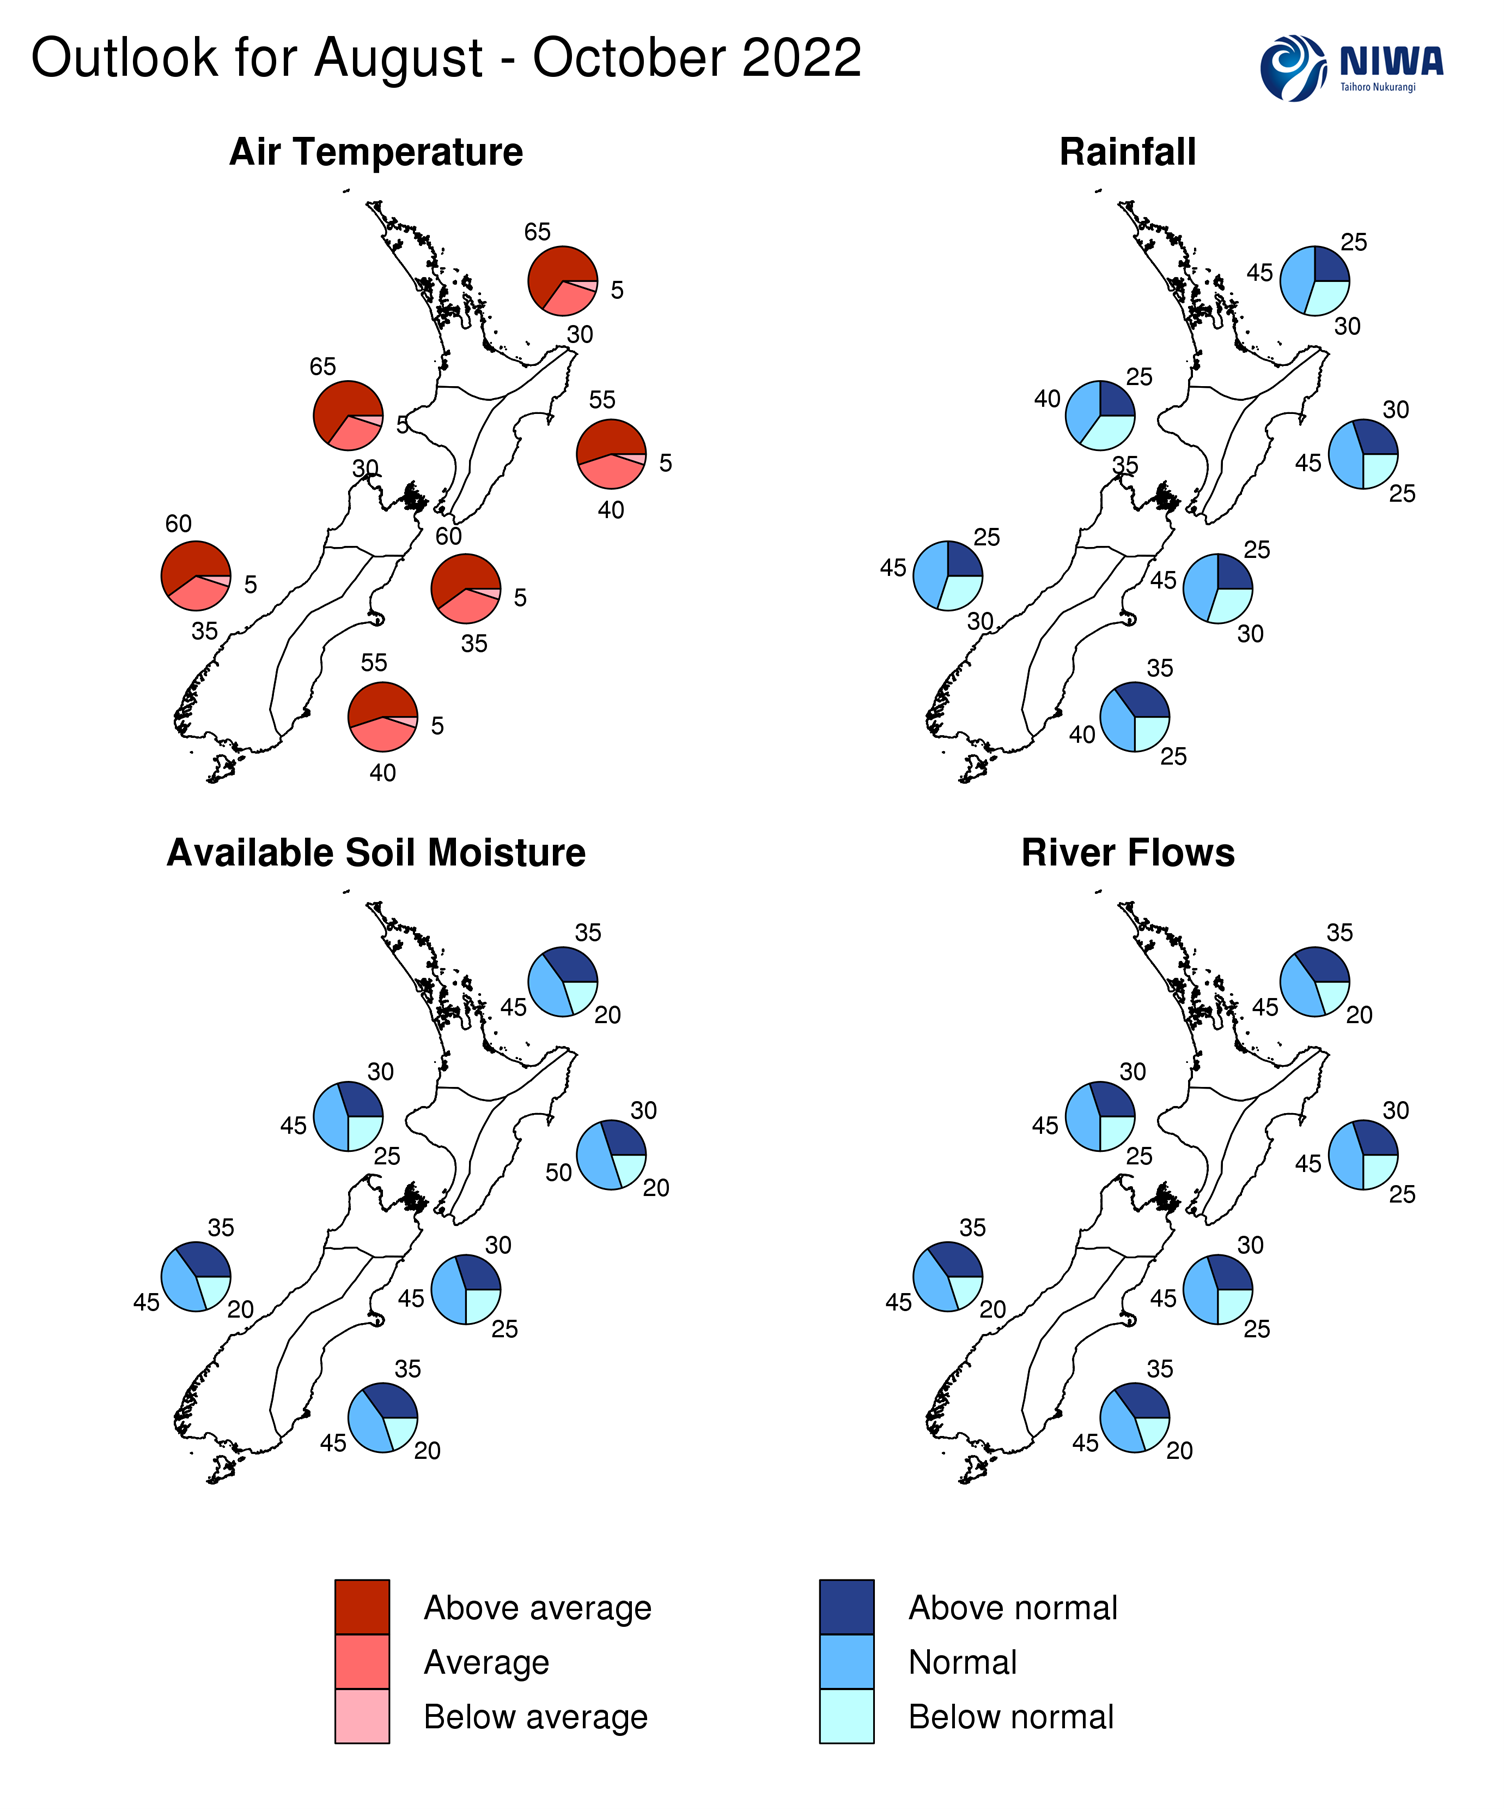
Graphical representation of the regional probabilities
Background
The NINO3.4 Index anomaly (in the central equatorial Pacific) over the last month (through 24 July) was -0.32˚C (climatology: 1961-1990); the latest weekly anomaly was -0.40˚C, showing a late-month cooling trend. The index was -0.60˚C relative to the more modern 1991-2020 climatological period.
The provisional July monthly SOI was +0.6 and +1.6 from May-July, the latter remaining firmly on the La Niña side of the spectrum.
Large changes took place in the subsurface equatorial Pacific during July in response to much stronger than normal trade winds. The strong trades drove the development of an upwelling Kelvin wave, which will likely further cool the equatorial Pacific in the coming months.
As of the end of July, substantially cooler than average subsurface waters (3˚C to 5˚C below average) were focused in the central Pacific, particularly at 100-150 m depth. This was bookended by warmer than average waters in the eastern and western parts of the basin. The effect of the upwelling Kelvin wave will likely see cooler waters migrate eastward and toward the surface over the next 1-2 months, reinforcing the oceanic La Niña signal.
Trade winds across the equatorial Pacific were much stronger than normal during July, in some cases by as much as 10-15 knots – this qualified as near-record strength. This was associated with rapidly cooling sub-surface ocean temperatures across the central part of the basin. Strong to very strong trade winds are predicted to continue over the next month or beyond with a high likelihood for cooling seas.
Taking these factors into account, La Niña conditions are most likely to continue during August-October (70% chance). During November-January, there is a 65% chance for La Niña and a 35% chance for ENSO neutral. During February-April, ENSO neutral is favoured at 65%. Overall, this implies that a “triple dip” La Niña (three consecutive La Niña events from 2020-2022) is very likely.
A SST seesaw in the Indian Ocean, called the Indian Ocean Dipole (IOD), was in its negative phase during July. A moderate-to-strong negative IOD event is likely during late winter and spring. The combined effect of the negative IOD and La Niña signal may bring a pattern of fewer westerly winds to New Zealand with more frequent anticyclones progressing from southwest to northeast across the country. This pattern could also allow low pressure systems to track toward the country from the northwest from time to time – such systems caused heavy rainfall and flooding during July.
During July, convective forcing focused over the eastern Indian Ocean, Maritime Continent, and western Pacific, as influenced by a combination of low frequency forcing from the lingering La Niña, a developing negative Indian Ocean Dipole, the Madden-Julian Oscillation (MJO), and a sequence of Kelvin waves.
The first half of August will see an MJO event over Africa progress into the eastern Indian Ocean (phases 1-3). This may evolve into a series of Kelvin waves that progress from the Pacific into the Atlantic Ocean during the mid and late month, coupled with low frequency forcing from the IOD and La Niña. Compared to July, there is less convective forcing predicted across the Pacific, which should have a material effect on New Zealand’s weather patterns. Historically, phases 1-3 during August have favoured drier conditions in the north and west of both islands. Despite this, several heavy fronts are likely in the western South Island during the first week of the month.
In September, convective forcing looks to continue to favour the Indian Ocean and Maritime Continent (phases 2-3) with intermittent high-frequency forcing further east. These phases tended to be associated with drier than normal conditions in the upper North Island.
For August-October as a whole, phase 4 was associated with well above average temperatures. This phase appears more likely to occur in September and/or October.
The Southern Annular Mode (SAM) was in its positive phase for much of July, despite the unsettled weather in the New Zealand region. This was consistent with the background La Niña-like forcing as well as a large and strong negative pressure anomaly over Antarctica. The SAM will likely continue to spend more time in its positive phase over the coming months, particularly if climate models’ predictions of higher air pressure around New Zealand eventuate.
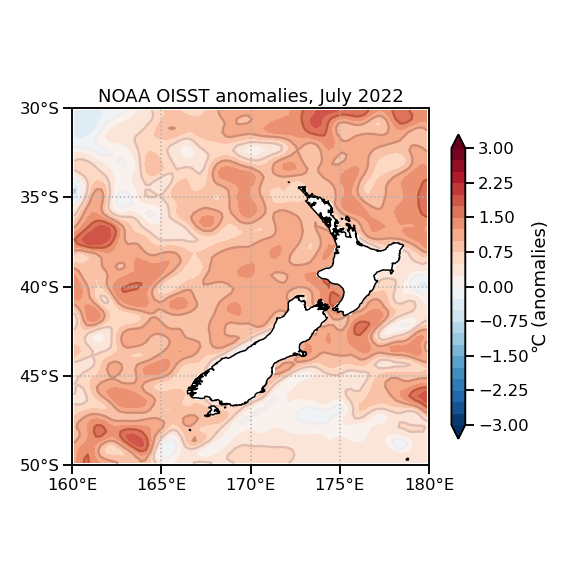
New Zealand’s coastal water temperatures remained above average during July, although anomaly values decreased in all climate regions. Patchy marine heatwave conditions continued in New Zealand’s offshore waters. Model guidance remains consistent in its expectation for above average sea surface temperatures over the next three to six months, showing an increase in anomaly values from late spring into early summer. For more information, see the NIWA Sea Surface Temperature Update.
NZ coastal SST anomalies (through 27 July)
|
North NI |
0.88˚C |
|
West NI |
1.33˚C |
|
East NI |
0.68˚C |
|
North SI |
1.01˚C |
|
West SI |
0.47˚C |
|
East SI |
0.92˚C |
Forecast Confidence
Temperature
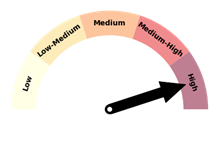
|
Forecast confidence for temperatures is high. A predicted lack of southerly fronts, occasional low pressure systems from the north transporting warmth and humidity, and higher than normal spring air pressure in the New Zealand region will increase the odds for above average temperatures. |
Rainfall
|
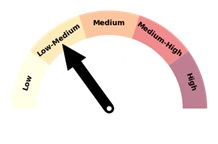
|
Forecast confidence for rainfall is low-medium. A transition toward more high pressure systems in the New Zealand region during spring could result in fewer westerly winds and dry spells in western areas. Low pressure systems could track in from the northwest periodically, increasing the odds for heavy rainfall. |