Outlook Summary
- A central Pacific El Niño event continued during March as the ocean and atmosphere remained weakly coupled. Sea surface temperatures warmed across the equatorial Pacific during March and El Niño is expected to continue during the upcoming three-month period.
- While April – June 2019 is expected to start off with mixed air flows, higher pressure than normal is forecast to develop in the northern Tasman Sea along with lower pressure than normal south of New Zealand. This is expected to result in more westerly quarter winds than normal, particularly during the second half of the coming season.
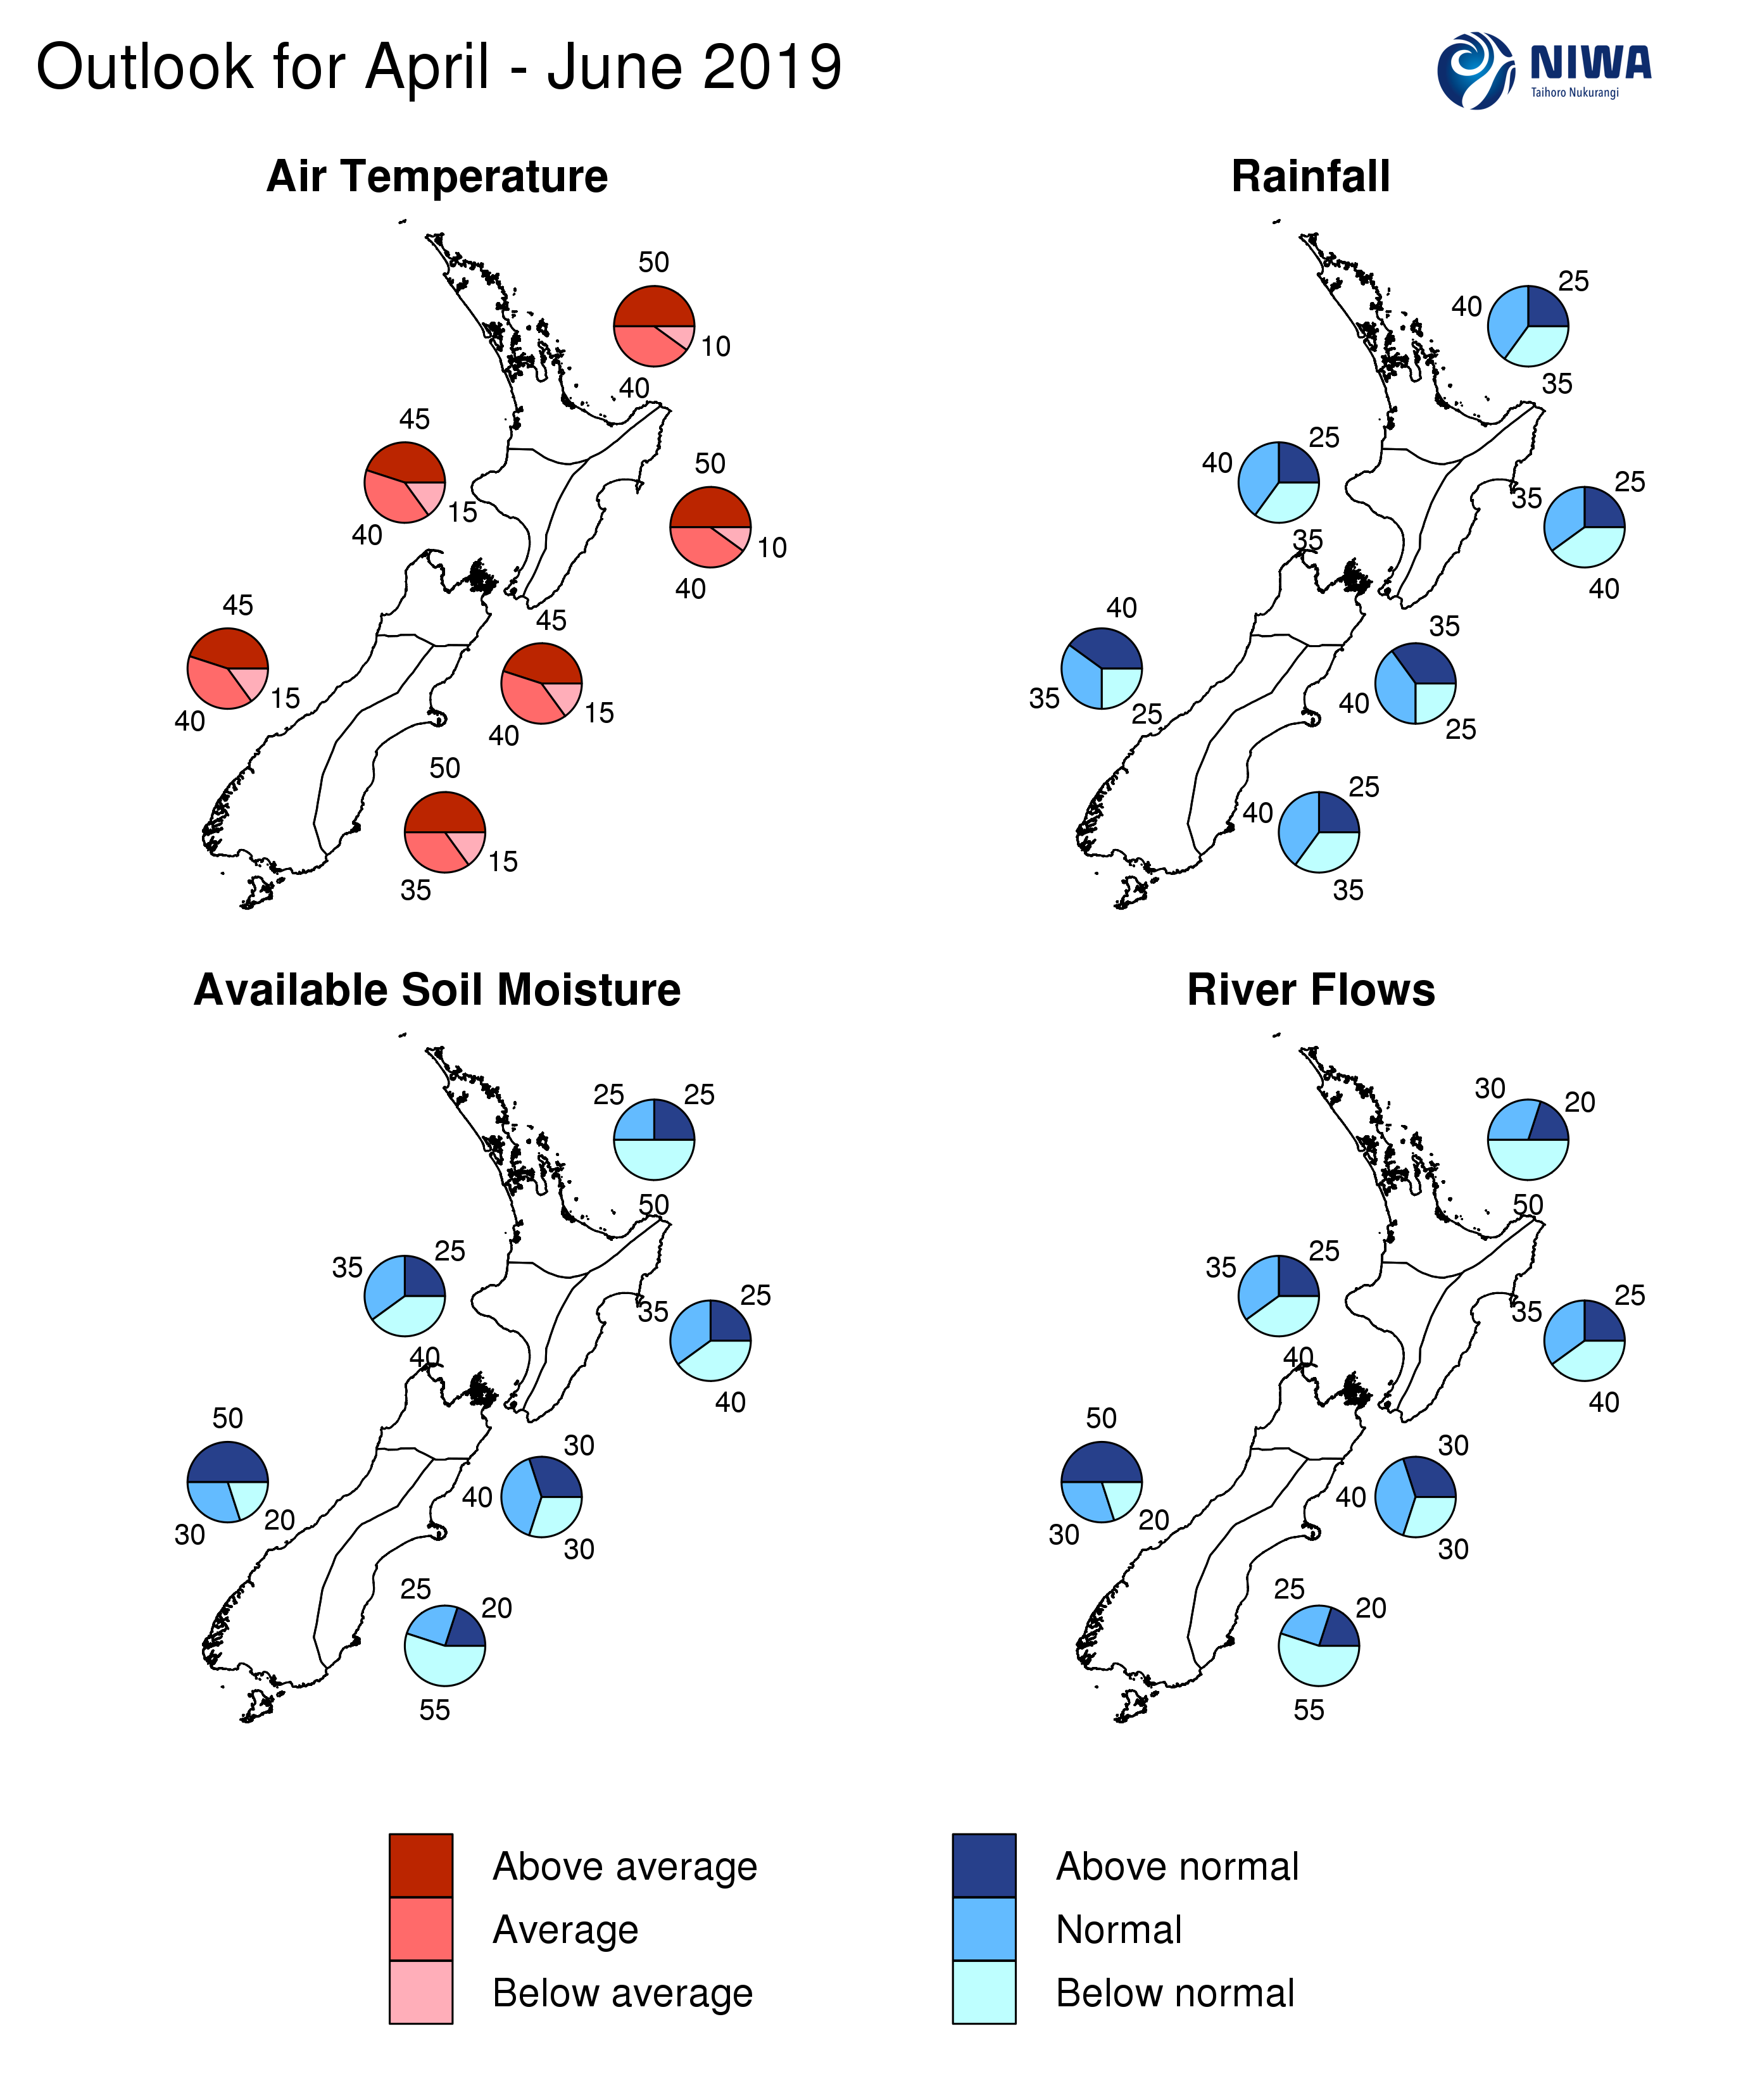
- Air temperatures are forecast to be above average in the north and east of the North Island and east of the South Island and about equally likely to be above average or near average in all remaining regions of New Zealand for April – June 2019.
- Rainfall is about equally likely to be above normal or near normal in the west and north of the South Island and about equally likely to be below normal or near normal for all remaining regions of New Zealand.
- Well above average coastal and Tasman Sea surface temperatures, including marine heatwave conditions, are forecast to have a strong influence on regional temperatures and may contribute to significant rain events.
- For the current tropical cyclone season (November 2018 to April 2019), NIWA’s Southwest Pacific Tropical Cyclone Outlook indicates that the risk for New Zealand is near normal. On average, at least one ex-tropical cyclone passes within 550 km of New Zealand each year. Significant rainfall, damaging winds, and coastal damage can occur during these events.
April – June 2019 temperatures are forecast to be above average in the north and east of the North Island and east of the South Island (50% chance) and about equally likely to be above average (45% chance) or near average (40% chance) in all remaining regions of New Zealand. However, cold snaps and frosts are likely to occur, particularly in colder locations, as the season progresses.
April – June 2019 rainfall is about equally likely to be above normal (35-40% chance) or near normal (35-40% chance) in the west and north of the South Island and about equally likely to be below normal (35-40% chance) or near normal (35-40% chance) for all remaining regions of New Zealand.
April – June 2019 soil moisture levels and river flows are most likely to be below normal (50-55% chance) in the north of the North Island and east of the South Island. For the west of the South Island, soil moisture levels and river flows are most likely to be above normal (50% chance). In the north of the South Island, soil moisture levels and river flows are most likely to be in the near normal range (40% chance). For the west and east of the North Island, soil moisture levels and river flows are about equally likely to be below normal (40% chance) or near normal (35% chance).
Regional predictions for the April – June 2019 season
Northland, Auckland, Waikato, Bay of Plenty
The table below shows the probabilities (or percent chances) for each of three categories: above average, near average, and below average. In the absence of any forecast guidance there would be an equal likelihood (33% chance) of the outcome being in any one of the three categories. Forecast information from local and global guidance models is used to indicate the deviation from equal chance expected for the coming three-month period, with the following outcomes the most likely (but not certain) for this region:
- Temperatures are most likely to be above average (50% chance).
- Rainfall totals are about equally likely to be near normal (40% chance) or below normal (35% chance).
- Soil moisture levels and river flows are most likely to be below normal (50% chance).
The full probability breakdown is:
|
Temperature |
Rainfall |
Soil moisture |
River flows |
|
|
Above average |
50 |
25 |
25 |
20 |
|
Near average |
40 |
40 |
25 |
30 |
|
Below average |
10 |
35 |
50 |
50 |
Central North Island, Taranaki, Whanganui, Manawatu, Wellington
Probabilities are assigned in three categories: above average, near average, and below average.
- Temperatures are about equally likely to be above average (45% chance) or near average (40% chance).
- Rainfall totals are about equally likely to be near normal (40% chance) or below normal (35% chance).
- Soil moisture levels and river flows are about equally likely to be below normal (40% chance) or near normal (35% chance).
The full probability breakdown is:
|
Temperature |
Rainfall |
Soil moisture |
River flows |
|
|
Above average |
45 |
25 |
25 |
25 |
|
Near average |
40 |
40 |
35 |
35 |
|
Below average |
15 |
35 |
40 |
40 |
Gisborne, Hawke’s Bay, Wairarapa
Probabilities are assigned in three categories: above average, near average, and below average.
- Temperatures are most likely to be above average (50% chance).
- Rainfall totals are about equally likely to be below normal (40% chance) or near normal (35% chance).
- Soil moisture levels and river flows are about equally likely to be below normal (40% chance) or near normal (35% chance).
The full probability breakdown is:
|
Temperature |
Rainfall |
Soil moisture |
River flows |
|
|
Above average |
50 |
25 |
25 |
25 |
|
Near average |
40 |
35 |
35 |
35 |
|
Below average |
10 |
40 |
40 |
40 |
Tasman, Nelson, Marlborough, Buller
Probabilities are assigned in three categories: above average, near average, and below average.
- Temperatures are about equally likely to be above average (45% chance) or near average (40% chance).
- Rainfall totals are about equally likely to be near normal (40% chance) or above normal (35% chance).
- Soil moisture levels and river flows are most likely to be near normal (40% chance).
The full probability breakdown is:
|
Temperature |
Rainfall |
Soil moisture |
River flows |
|
|
Above average |
45 |
35 |
30 |
30 |
|
Near average |
40 |
40 |
40 |
40 |
|
Below average |
15 |
25 |
30 |
30 |
West Coast, Alps and foothills, inland Otago, Southland
Probabilities are assigned in three categories: above average, near average, and below average.
- Temperatures are about equally likely to be above average (45% chance) or near average (40% chance).
- Rainfall totals are about equally likely to be above normal (40% chance) or near normal (35% chance).
- Soil moisture levels and river flows are most likely to be above normal (50% chance).
The full probability breakdown is:
|
Temperature |
Rainfall |
Soil moisture |
River flows |
|
|
Above average |
45 |
40 |
50 |
50 |
|
Near average |
40 |
35 |
30 |
30 |
|
Below average |
15 |
25 |
20 |
20 |
Coastal Canterbury, east Otago
Probabilities are assigned in three categories: above average, near average, and below average.
- Temperatures are most likely to be above average (50% chance).
- Rainfall totals are about equally likely to be near normal (40% chance) or below normal (35% chance).
- Soil moisture levels and river flows are most likely to be in the below normal range (55% chance).
The full probability breakdown is:
|
Temperature |
Rainfall |
Soil moisture |
River flows |
|
|
Above average |
50 |
25 |
20 |
20 |
|
Near average |
35 |
40 |
25 |
25 |
|
Below average |
15 |
35 |
55 |
55 |
Graphical representation of the regional probabilities
Download
Seasonal climate outlook - April – June 2019 [PDF 3.6MB]
Notes to reporters and editors
- NIWA’s outlooks indicate the likelihood of climate conditions being at, above, or below average for the season as a whole. They are not ‘weather forecasts’. It is not possible to forecast precise weather conditions three months ahead of time.
- The outlooks are the result of the expert judgment of NIWA’s climate scientists. They take into account observations of atmospheric and ocean conditions and output from global and local climate models. The presence of El Niño or La Niña conditions and the sea surface temperatures around New Zealand can be a useful indicator of likely overall climate conditions for a season.
- The outlooks state the probability for above average conditions, near average conditions, and below average conditions for rainfall, temperature, soil moisture, and river flows. For example, for winter (June–July–August) 2007, for all the North Island, we assigned the following probabilities for temperature: · Above average: 60 per cent · Near average: 30 per cent · Below average: 10 per cent We therefore concluded that above average temperatures were very likely.
- This three-way probability means that a random choice would be correct only 33 per cent (or one-third) of the time. It would be like randomly throwing a dart at a board divided into three equal parts, or throwing a dice with three numbers on it. An analogy with coin tossing (a two-way probability) is not correct.
- A 50 per cent ‘hit rate’ is substantially better than guesswork, and comparable with the skill level of the best overseas climate outlooks. See, for example, analysis of global outlooks issued by the International Research Institute for Climate and Society based in the US published in the Bulletin of the American Meteorological Society (Goddard, L., A. G. Barnston, and S. J. Mason, 2003: Evaluation of the IRI’s “net assessment” seasonal climate forecasts 1997–2001. Bull. Amer. Meteor. Soc., 84, 1761–1781).
- Each month, NIWA publishes an online analysis of how well its outlooks perform. The analysis is sent to about 3500 recipients of NIWA’s newsletters, including many farmers.
- All outlooks are for the three months as a whole. There will inevitably be wet and dry days, and hot and cold days, within a season. The exact range in temperature and rainfall within each of the three categories varies with location and season. However, as a guide, the “near average” or middle category for the temperature predictions includes deviations up to ±0.5°C for the long-term mean, whereas for rainfall the “near normal” category lies between approximately 80 per cent and 115 per cent of the long-term mean.
- The seasonal climate outlooks are an output of a scientific research programme, supplemented by NIWA’s Capability Funding. NIWA does not have a government contract to produce these outlooks.
- Where probabilities are within 5% of one another, the term “about equally” is used.