Overview
Weak La Niña conditions segued to ENSO-neutral in the tropical Pacific during April 2018. The Southern Oscillation Index (SOI) over the last 30 days is positive at about +0.5. Sea surface temperatures (SSTs) warmed over the past month, although they remain slightly colder than average in the eastern equatorial Pacific Ocean.
Additionally, the layer of colder than normal SSTs is now very shallow (75 metres or less, except close to the South American coast where the depth is 100 metres) and discontiguous, with warmer than normal sub-surface water having spread eastward during April, to as far as 100°W.
The consensus from international models is for the tropical Pacific to persist in an ENSO-neutral state over the next three month period (79% chance over May – July 2018) and ENSO-neutral remains the most likely outcome over the late-winter and early spring seasons (July – September 2018). However, the forecast models favour El Niño conditions emerging in the tropical Pacific over the austral spring (September – November 2018).
The atmospheric circulation around New Zealand is forecast to be characterised by lower than normal atmospheric pressure through to July. This will result in mixed and changeable air flows across the country. Warmer than average ocean waters that are present around the country are also expected to persist through the next three months, though forecasts suggest they will gradually weaken to the west of New Zealand.
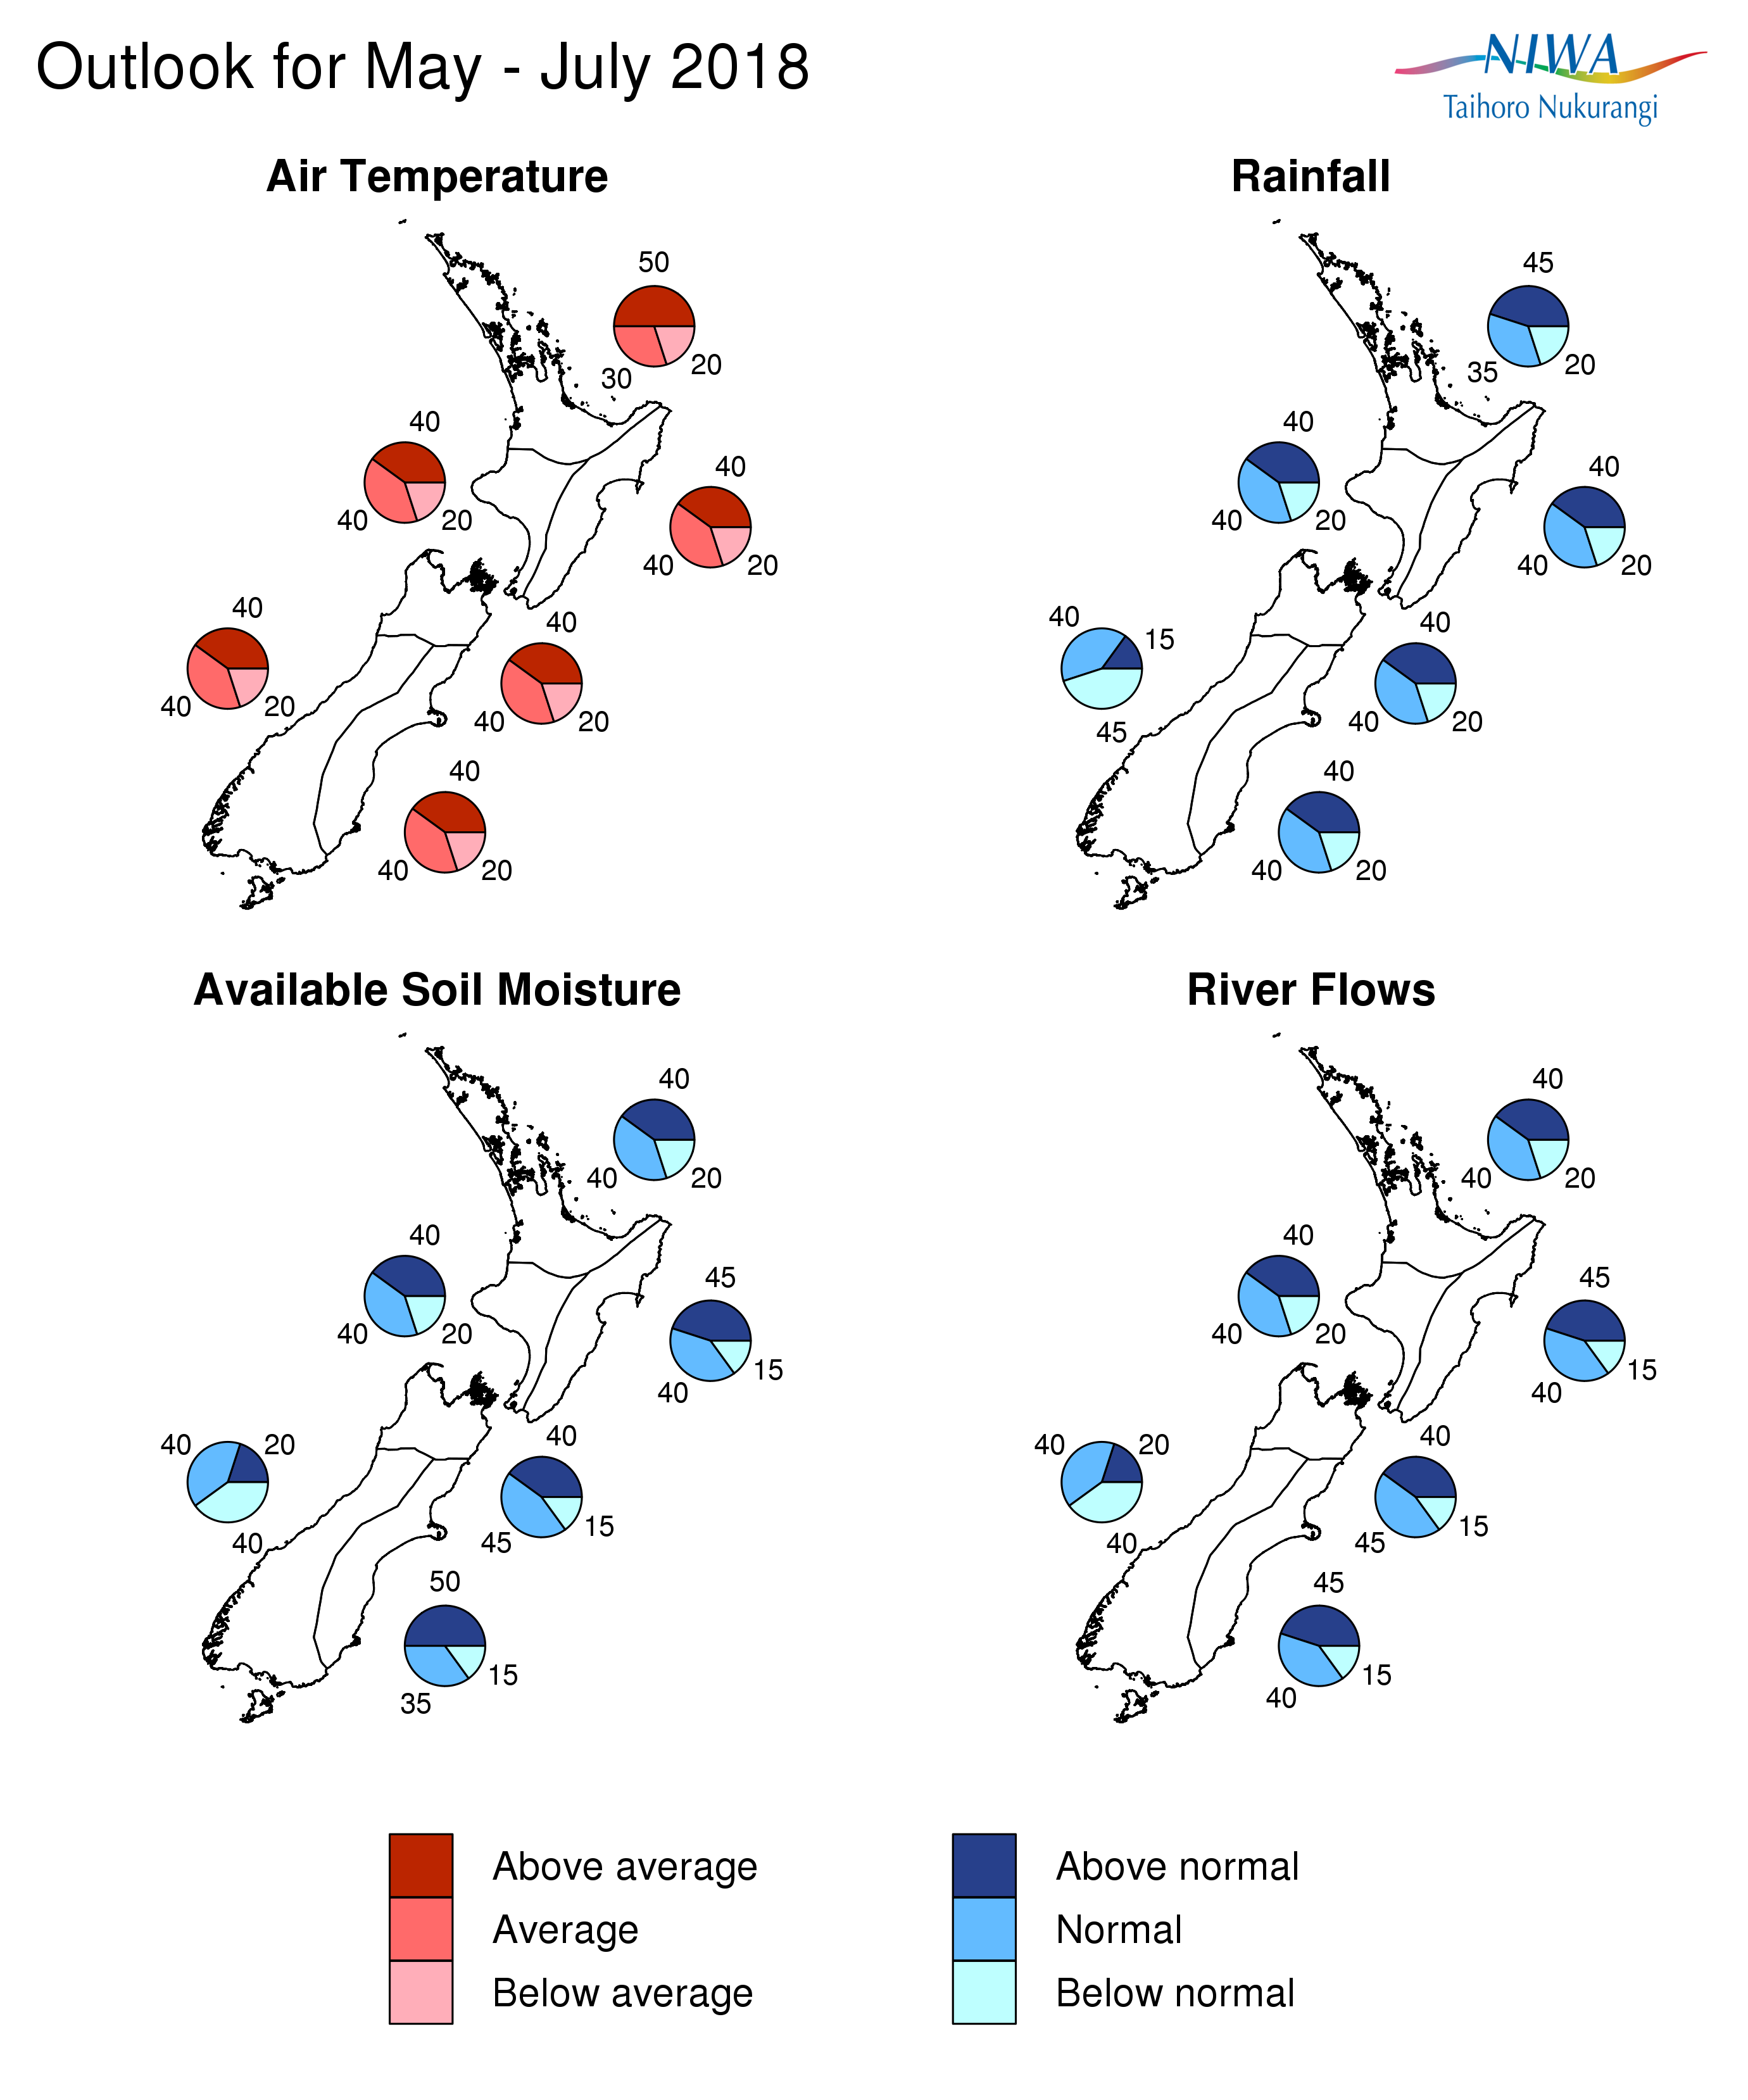
Outlook Summary
May – July 2018 temperatures are forecast to be above average (50% chance) in the north of the North Island and average (40% chance) or above average (40% chance) for all remaining regions of New Zealand. Despite the prospect for average or warmer than average temperatures, frosts and cold snaps will become more common, with some cold snaps possibly quite sharp.
May – July 2018 rainfall totals are forecast to be above normal (45% chance) in the north of the North Island, near normal (40% chance) or above normal (40% chance) for the rest of the North Island as well as the east and north of the South Island. Normal (40% chance) or below normal (45% chance) rainfall is expected for the west of the South Island. The combination of lower than normal sea level pressure over the New Zealand region and warmer than average Tasman Sea temperatures over the coming months will result in an elevated chance for significant rainfall events.
May – July 2018 soil moisture levels and river flows are expected to be near normal or above normal (40 – 45% chance) for all North Island regions and for the north of the South Island. For the east of the South Island, river flows are also expected to be near normal or above normal (40 – 45% chance), but with soil moisture levels forecast to be above normal (50% chance). For the west of the South Island, soil moisture levels and river flows are forecast to be normal (40% chance) or below normal (40% chance).
Regional predictions for the May – July 2018 season
Northland, Auckland, Waikato, Bay of Plenty
The table below shows the probabilities (or percent chances) for each of three categories: above average, near average, and below average. In the absence of any forecast guidance there would be an equal likelihood (33% chance) of the outcome being in any one of the three categories. Forecast information from local and global guidance models is used to indicate the deviation from equal chance expected for the coming three-month period, with the following outcomes the most likely (but not certain) for this region:
- Temperatures are likely to be above average (50% chance).
- Rainfall totals are likely to be above normal. (45% chance).
- Soil moisture levels and river flows are equally likely to be in the near normal (40% chance) or above normal range (40% chance).
The full probability breakdown is:
|
Temperature |
Rainfall |
Soil moisture |
River flows |
|
|
Above average |
50 |
45 |
40 |
40 |
|
Near average |
30 |
35 |
40 |
40 |
|
Below average |
20 |
20 |
20 |
20 |
Central North Island, Taranaki, Whanganui, Manawatu, Wellington
Probabilities are assigned in three categories: above average, near average, and below average.
- Temperatures are equally likely to be near average (40% chance) or above average (40% chance).
- Rainfall totals, soil moisture levels and river flows are equally likely to be in the near normal (40% chance) or above normal range (40% chance).
The full probability breakdown is:
|
Temperature |
Rainfall |
Soil moisture |
River flows |
|
|
Above average |
40 |
40 |
40 |
40 |
|
Near average |
40 |
40 |
40 |
40 |
|
Below average |
20 |
20 |
20 |
20 |
Gisborne, Hawke’s Bay, Wairarapa
Probabilities are assigned in three categories: above average, near average, and below average.
- Temperatures are equally likely to be near average (40% chance) or above average (40% chance).
- Rainfall totals, soil moisture levels and river flows are all about equally likely to be in the near normal (40% chance) or above normal range (40-45% chance).
The full probability breakdown is:
|
Temperature |
Rainfall |
Soil moisture |
River flows |
|
|
Above average |
40 |
40 |
45 |
45 |
|
Near average |
40 |
40 |
40 |
40 |
|
Below average |
20 |
20 |
15 |
15 |
Tasman, Nelson, Marlborough, Buller
Probabilities are assigned in three categories: above average, near average, and below average.
- Temperatures are equally likely to be near average (40% chance) or above average (40% chance).
- Rainfall totals, soil moisture levels and river flows are all about equally likely to be in the near normal (40% chance) or above normal range (40-45% chance).
The full probability breakdown is:
|
Temperature |
Rainfall |
Soil moisture |
River flows |
|
|
Above average |
40 |
40 |
40 |
40 |
|
Near average |
40 |
40 |
45 |
45 |
|
Below average |
20 |
20 |
15 |
15 |
West Coast, Alps and foothills, inland Otago, Southland
Probabilities are assigned in three categories: above average, near average, and below average.
- Temperatures are equally likely to be near average (40% chance) or above average (40% chance).
- Rainfall totals are about equally likely to be near normal (40% chance) or below normal (45% chance)
- Soil moisture levels and river flows are equally likely to be in the below normal (40% chance) or normal range (40% chance).
The full probability breakdown is:
|
Temperature |
Rainfall |
Soil moisture |
River flows |
|
|
Above average |
40 |
15 |
20 |
20 |
|
Near average |
40 |
40 |
40 |
40 |
|
Below average |
20 |
45 |
40 |
40 |
Coastal Canterbury, east Otago
Probabilities are assigned in three categories: above average, near average, and below average.
- Temperatures are equally likely to be near average (40% chance) or above average (40% chance).
- Rainfall totals are equally likely to be normal (40% chance) or above normal (40% chance).
- Soil moisture levels are likely to be above normal (50% chance).
- River flows are about equally likely to be in the near normal (40% chance) or above normal range (45% chance).
The full probability breakdown is:
|
Temperature |
Rainfall |
Soil moisture |
River flows |
|
|
Above average |
40 |
40 |
50 |
45 |
|
Near average |
40 |
40 |
35 |
40 |
|
Below average |
20 |
20 |
15 |
15 |
Graphical representation of the regional probabilities
Background
Sea surface temperatures (SSTs) in the central and eastern equatorial Pacific Ocean remained below normal during April 2018, but continued to weaken relative to March values. The NINO3.4 index remains negative at -0.33°C (was -0.61oC last month), the NINO3 index is at -0.20°C (was -0.57°C last month), and the NINO4 index is +0.02oC (was -0.07oC for March). The NINO1+2 region, in the far eastern Pacific, warmed considerably in late April, with positive SST anomalies present.
In the subsurface ocean, (within the first 150 metres of the ocean) positive temperature anomalies shifted east of 140°W during the month of April and now extend across most of the equatorial Pacific. Significant positive anomalies (> +3oC) have now persisted in the central Pacific basin (170-160oW), centred at about 150m depth, for the second consecutive month. The only subsurface region exhibiting cooler than average temperatures was confined to areas around and east of 100°W.
The warming subsurface was in response to a strong downwelling Kelvin wave in the ocean. Another westerly wind burst developed in late April and has resulted in an additional equatorial oceanic Kelvin wave west of the Date Line. Dynamical model guidance indicates reduced trade winds or westerly winds will persist through early May near and west of the Date Line. Consequently, this may result in additional warming of the equatorial subsurface and/or surface.
The SOI has shown considerable variability since the beginning of the year, and is currently on the La Niña side of neutral, with a preliminary value of +0.5 for April 2018.
April 2018 rainfall and convection anomalies in the tropical Pacific changed significantly, especially over and east of the Maritime Continent. In this region, anomalously wet conditions in March gave way to anomalously dry conditions in April. This resulted in a dramatic change in the ENSO Precipitation Index (ESPI). While the value remained negative during the month (-0.4 for the last 30 days to the 29th of April 2018), it increased, or became much less negative from the March value of -1.1.
The Intertropical Convergence Zone remains shifted north of its climatological position in the central Pacific, while the South Pacific Convergence Zone was more active than it was in March and was located south of its climatological position.
In summary, with the significant shift in rainfall patterns over the western equatorial Pacific and Maritime Continent, combined with the warming of equatorial waters, particularly in the subsurface and east of the Date Line, ENSO-neutral is expected to continue over the next few months: the international consensus is for ENSO-neutral conditions over the next 3 month period (75% chance over May – July 2018) as well as the most likely outcome over the late-winter and early spring seasons (July – September 2018). The forecast models favour El Niño conditions during the spring (September – November 2018).
The warmest coastal anomalies (for the past three months) are around the west of the South Island, where they remain at least +2.0oC above normal. According to the dynamical models’ forecasts, warmer than average SSTs are likely to persist for at least part of the next 3 months (May – July 2018).
Contact
Chris Brandolino, Principal Scientist – Forecasting, NIWA National Climate Centre Tel (09) 375 6335, Mobile (027) 886 0014
Dr Brett Mullan, Principal Scientist, NIWA National Climate Centre Tel (04) 386 0508, Mobile (027) 294 1169
Notes to reporters and editors
- NIWA’s outlooks indicate the likelihood of climate conditions being at, above, or below average for the season as a whole. They are not ‘weather forecasts’. It is not possible to forecast precise weather conditions three months ahead of time.
- The outlooks are the result of the expert judgment of NIWA’s climate scientists. They take into account observations of atmospheric and ocean conditions and output from global and local climate models. The presence of El Niño or La Niña conditions and the sea surface temperatures around New Zealand can be a useful indicator of likely overall climate conditions for a season.
- The outlooks state the probability for above average conditions, near average conditions, and below average conditions for rainfall, temperature, soil moisture, and river flows. For example, for winter (June–July–August) 2007, for all the North Island, we assigned the following probabilities for temperature: · Above average: 60 per cent · Near average: 30 per cent · Below average: 10 per cent We therefore concluded that above average temperatures were very likely.
- This three-way probability means that a random choice would be correct only 33 per cent (or one-third) of the time. It would be like randomly throwing a dart at a board divided into three equal parts, or throwing a dice with three numbers on it. An analogy with coin tossing (a two-way probability) is not correct.
- A 50 per cent ‘hit rate’ is substantially better than guesswork, and comparable with the skill level of the best overseas climate outlooks. See, for example, analysis of global outlooks issued by the International Research Institute for Climate and Society based in the US published in the Bulletin of the American Meteorological Society (Goddard, L., A. G. Barnston, and S. J. Mason, 2003: Evaluation of the IRI’s “net assessment” seasonal climate forecasts 1997–2001. Bull. Amer. Meteor. Soc., 84, 1761–1781).
- Each month, NIWA publishes an analysis of how well its outlooks perform. This is available online and is sent to about 3500 recipients of NIWA’s newsletters, including many farmers.
- All outlooks are for the three months as a whole. There will inevitably be wet and dry days, and hot and cold days, within a season. The exact range in temperature and rainfall within each of the three categories varies with location and season. However, as a guide, the “near average” or middle category for the temperature predictions includes deviations up to ±0.5°C for the long-term mean, whereas for rainfall the “near normal” category lies between approximately 80 per cent and 115 per cent of the long-term mean.
- The seasonal climate outlooks are an output of a scientific research programme, supplemented by NIWA’s Capability Funding. NIWA does not have a government contract to produce these outlooks.
- Where probabilities are within 5% of one another, the term “about equally” is used.