Strong El Niño conditions are present in the tropical Pacific ocean. Sea surface temperature anomalies in the central and eastern Pacific intensified during August 2015 and are now close to +2oC. The Southern Oscillation Index (SOI) is strongly negative (-2.0 for August 2015, value estimated on the 2nd of September) and westerly wind anomalies (weaker trade-winds) dominate the central and western equatorial Pacific, indicating a strong coupling between the ocean and the atmosphere.
International guidance indicates that El Niño is certain (100% chance) to continue over the next three months (September – November 2015) and extremely likely (above 90% chance) to persist into summer 2015/2016. The current state of the ocean-atmosphere in the Pacific and the international consensus forecast suggest that this event could then rank amongst the 4 strongest El Niño events recorded (along with 1972/73, 1982/83 and 1997/98).
During September – November 2015, above normal pressure is forecast over and to the south of Australia, while below normal pressure is expected to the east of New Zealand. This circulation pattern is likely to be accompanied with anomalous southwesterly winds.
Sea surface temperatures are forecast to be normal or below normal in the Tasman west of New Zealand, while surface water temperatures are expected to be in the below normal range to the east of the country.
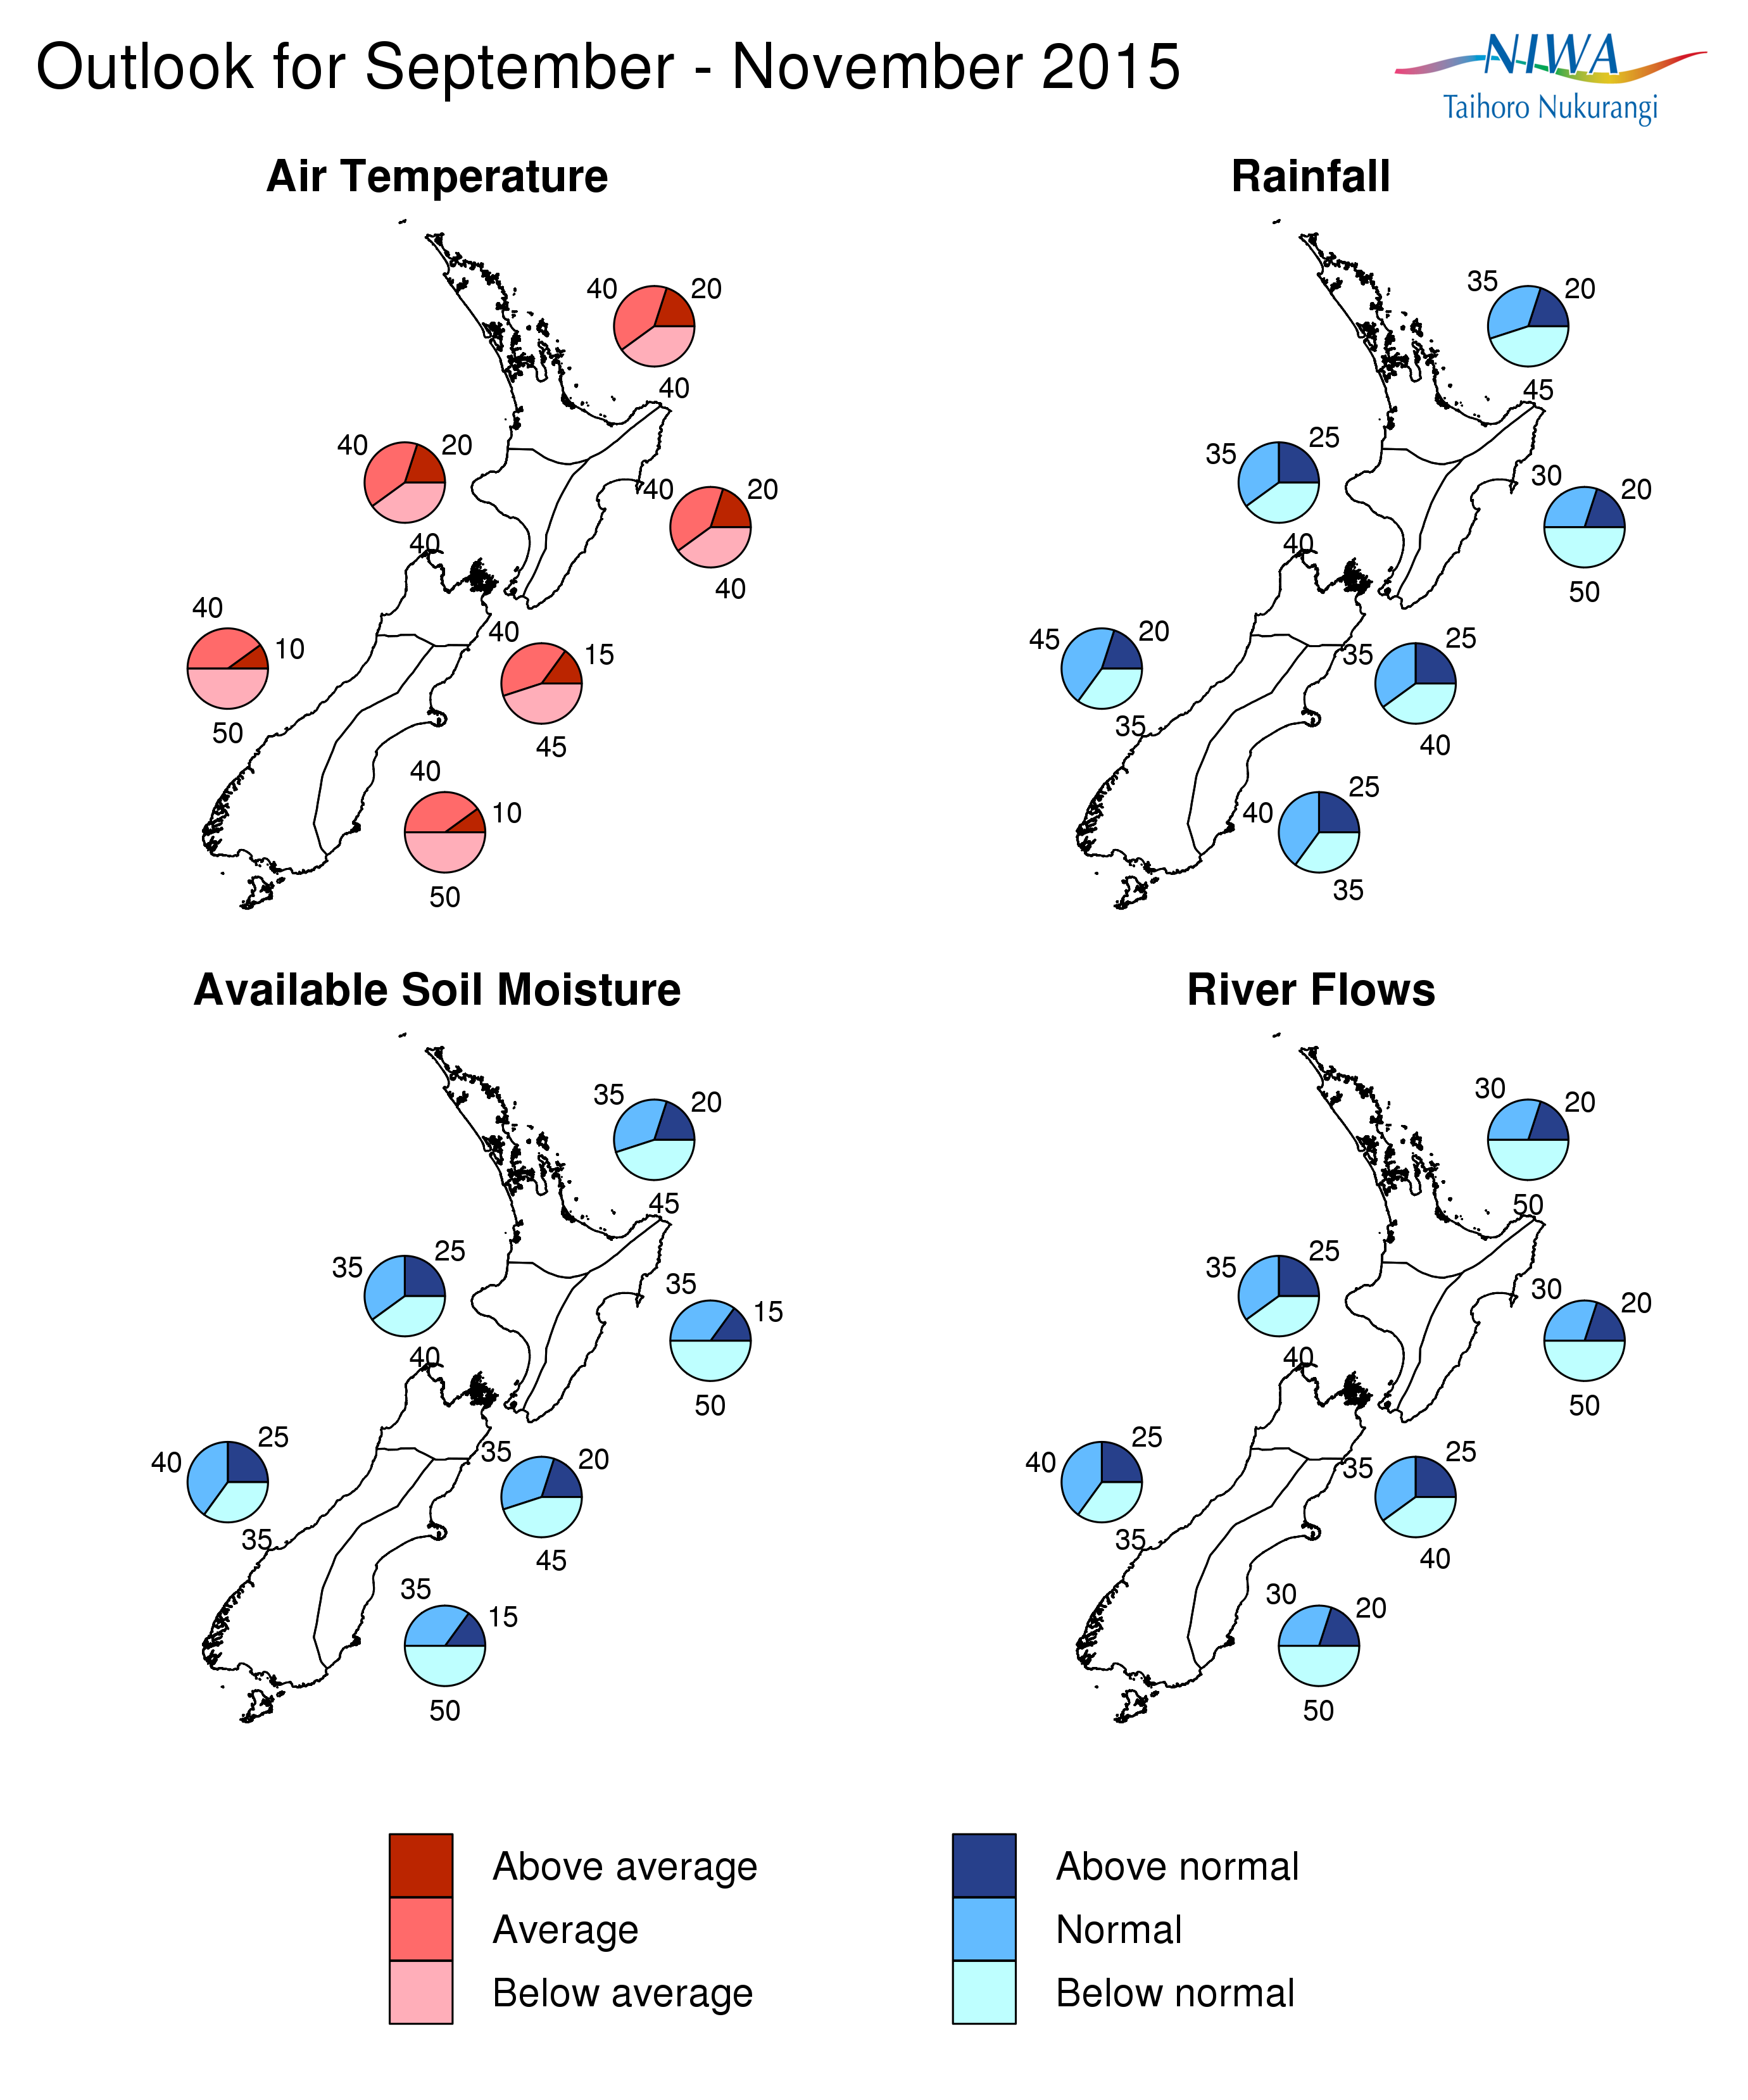
Outlook Summary
September – November 2015 temperatures are about equally likely (40-45% chance) to be average or below average for the North Island and in the north of the South Island. Mean temperatures for the season as a whole are most likely (50% chance) to be in the below average range for the west and east of the South Island. Cold snaps and frosts are to be expected in some parts of the country from time to time.
September – November 2015 rainfall totals are most likely (45-50% chance) to be in the below normal range for the north and east of the North Island. Seasonal rainfall totals are about equally likely (35-40% chance) to be in the near normal or below normal range in the west of the North Island and the north and east of the South Island. Near normal rainfall is the most likely outcome (45% chance) for the west of South Island.
September – November 2015 soil moisture levels and river flows are most likely (45-50% chance) to be below normal in the north and east of the North Island and the east of the South Island. In the western regions of both Islands, soil moisture levels and river flows are about equally likely (35-40% chance) to be in the near normal or below normal range. In the north of the South Island, soil moisture levels are most likely (45% chance) to be below normal, and river flows are about equally likely (35-40% chance) to be in the near normal or below normal range.
Regional predictions for the August to October season
Northland, Auckland, Waikato, Bay of Plenty
The table below shows the probabilities (or percent chances) for each of three categories: above average, near average, and below average. In the absence of any forecast guidance there would be an equal likelihood (33% chance) of the outcome being in any one of the three categories. Forecast information from local and global guidance models is used to indicate the deviation from equal chance expected for the coming three month period, with the following outcomes the most likely (but not certain) for this region:
- Temperatures are equally likely (40% chance) to be near average or below average.
- Rainfall totals, soil moisture levels and river flows are all most likely (45 - 50% chance) to be in the below normal range.
Other outcomes cannot be excluded. The full probability breakdown is:
|
Temperature |
Rainfall |
Soil moisture |
River flows |
|
|
Above average |
20 |
20 |
20 |
20 |
|
Near average |
40 |
35 |
35 |
30 |
|
Below average |
40 |
45 |
45 |
50 |
Central North Island, Taranaki, Wanganui, Manawatu, Wellington
Probabilities are assigned in three categories: above average, near average, and below average.
- Temperatures are equally likely (40% chance) to be near or below average.
- Rainfall totals, soil moisture levels and river flows are about equally likely (35 - 40% chance) to be in the below normal or near normal range.
The full probability breakdown is:
|
Temperature |
Rainfall |
Soil moisture |
River flows |
|
|
Above average |
20 |
25 |
25 |
25 |
|
Near average |
40 |
35 |
35 |
35 |
|
Below average |
40 |
40 |
40 |
40 |
Gisborne, Hawke’s Bay, Wairarapa
Probabilities are assigned in three categories: above average, near average, and below average.
- Temperatures are equally likely (40% chance) to be average or below average.
- Rainfall totals, soil moisture levels and river flows are all most likely (50% chance) to be in the below normal range.
The full probability breakdown is:
|
Temperature |
Rainfall |
Soil moisture |
River flows |
|
|
Above average |
20 |
20 |
15 |
20 |
|
Near average |
40 |
30 |
35 |
30 |
|
Below average |
40 |
50 |
50 |
50 |
Nelson, Marlborough, Buller
Probabilities are assigned in three categories: above average, near average, and below average.
- Temperatures are about equally likely (40-45% chance) to be near average or below average.
- Rainfall and river flows are about equally likely (35-40% chance) to be in the near normal or below normal range.
- Soil moisture levels are most likely (45% chance) to be in the below normal range.
The full probability breakdown is:
|
Temperature |
Rainfall |
Soil moisture |
River flows |
|
|
Above average |
15 |
25 |
20 |
25 |
|
Near average |
40 |
35 |
35 |
35 |
|
Below average |
45 |
40 |
45 |
40 |
West Coast, Alps and foothills, inland Otago, Southland
Probabilities are assigned in three categories: above average, near average, and below average.
- Temperatures are most likely (50% chance) to be in the below average range.
- Rainfall totals are most likely (45%) to be in the near normal range.
- Soil moisture levels and river flows are about equally likely (35-40% chance) to be in the near normal or below normal range.
The full probability breakdown is:
|
Temperature |
Rainfall |
Soil moisture |
River flows |
|
|
Above average |
10 |
20 |
25 |
25 |
|
Near average |
40 |
45 |
40 |
40 |
|
Below average |
50 |
35 |
35 |
35 |
Coastal Canterbury, east Otago
Probabilities are assigned in three categories: above average, near average, and below average.
- Temperatures are most likely (50% chance) to be in the below average range.
- Rainfall totals are about equally likely (35-40% chance) to be in the near normal or below normal range.
- Soil moisture levels and river flows are most likely (50% chance) to be in the below normal range.
The full probability breakdown is:
|
Temperature |
Rainfall |
Soil moisture |
River flows |
|
|
Above average |
10 |
25 |
15 |
20 |
|
Near average |
40 |
40 |
35 |
30 |
|
Below average |
50 |
35 |
50 |
50 |
Graphical representation of the regional probabilities
Background
Sea surface temperature (SST) anomalies have continued to increase in the eastern and central Pacific in August 2015. Sub-surface ocean temperature and heat content anomalies in the eastern Pacific have also intensified dramatically in the past few weeks and have the potential to sustain and support a further increase of the current strong surface anomalies.
The Southern Oscillation Index (SOI) remained strongly negative since July 2015 and is at -2.0 for the month of August 2015 (value estimated on the 2nd of September). Westerly wind anomalies (i.e. a weakening of the trade-winds and occasional easterly winds) continued to dominate the central and western Pacific in August 2015. As was the case last month, convection and rainfall was suppressed in the western Pacific and over the Maritime Continent, while the central and eastern Pacific experienced much more intense than normal rainfall and convection. Together, these signals indicate a strong coupling between the ocean and the atmosphere, a condition necessary for the continued development and strengthening of the current El Niño conditions.
International guidance indicates that El Niño is certain (100% chance) to continue over the next three months period (September – November 2015) and extremely likely (above 90% chance) to persist into the summer 2015/2016. The current state of the ocean-atmosphere in the Pacific and the international consensus forecast suggest that this event could rank amongst the 4 strongest El Niño events recorded (along with 1972/73, 1982/83 and 1997/98).
Note that El Niño events are typically (but not always) associated with stronger and/or more frequent southerwesterly winds during spring in New Zealand. Such a circulation pattern typically leads to cooler conditions in most regions of the country and wetter conditions to the west of the Southern Alps. The next three months (September – November 2015) circulation and temperature forecasts in particular broadly reflect these typical impacts.
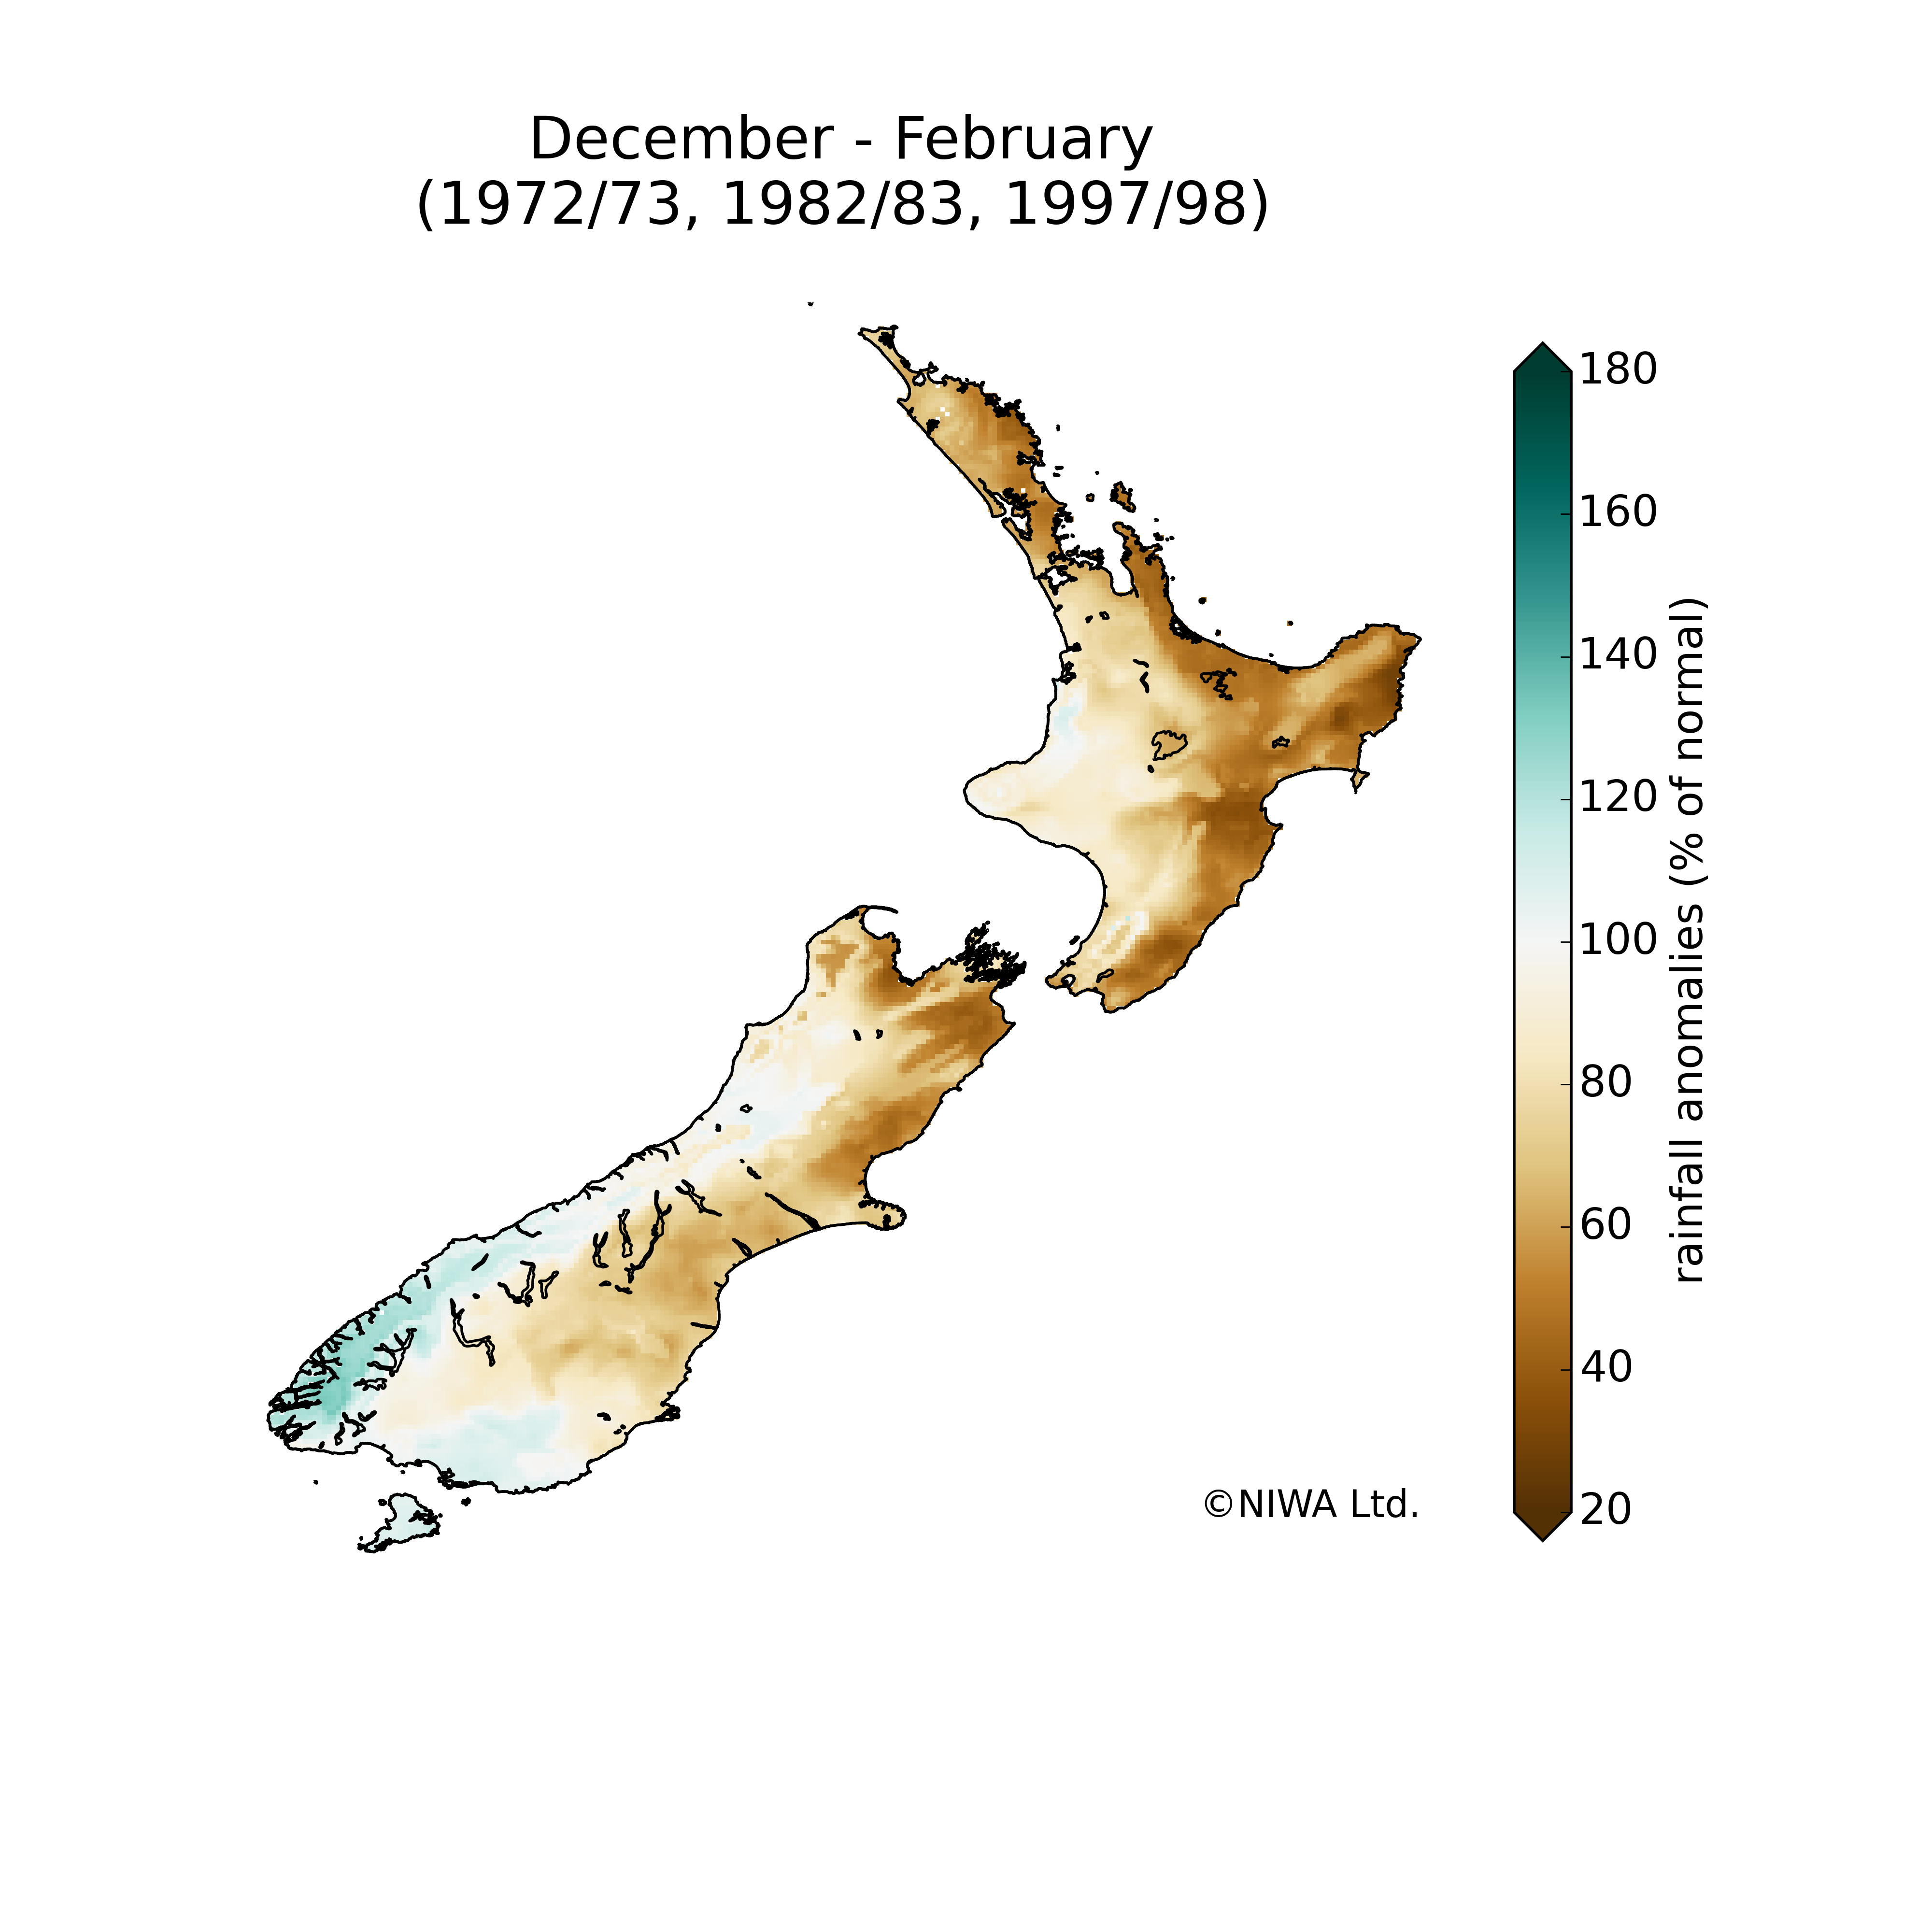
For reference the figure below shows the average rainfall amounts (in percentage of the 1981-2010 normal) that were recorded for the summer season (December – February) during the three largest El Niño events listed above. Based on this record, an elevated risk for drought for parts of New Zealand is anticipated later during summer, in particular for eastern parts of both islands as well as northern areas of the North Island.
Waters surrounding New Zealand are currently close to normal. Ocean models forecasts suggest that coastal waters will be in the normal or below normal range to the west of the country, and below normal to the east.
To find out more about normal conditions for this outlook period, refer to NIWA’s website, where daily updates on climate maps are available.
Contact
For comment, please contact:
Chris Brandolino, NIWA forecaster, NIWA National Climate Centre Tel (09) 375 6335, Mobile (027) 886 0014
Dr Brett Mullan, Principal Scientist, NIWA National Climate Centre Tel (04) 386 0508, Mobile (027) 294 1169.
Notes to reporters and editors
- NIWA’s outlooks indicate the likelihood of climate conditions being at, above, or below average for the season as a whole. They are not ‘weather forecasts’. It is not possible to forecast precise weather conditions three months ahead of time.
- The outlooks are the result of the expert judgment of NIWA’s climate scientists. They take into account observations of atmospheric and ocean conditions and output from global and local climate models. The presence of El Niño or La Niña conditions and the sea surface temperatures around New Zealand can be a useful indicator of likely overall climate conditions for a season.
- The outlooks state the probability for above average conditions, near average conditions, and below average conditions for rainfall, temperature, soil moisture, and river flows. For example, for winter (June–July–August) 2007, for all the North Island, we assigned the following probabilities for temperature: · Above average: 60 per cent · Near average: 30 per cent · Below average: 10 per cent We therefore concluded that above average temperatures were very likely.
- This three-way probability means that a random choice would be correct only 33 per cent (or one-third) of the time. It would be like randomly throwing a dart at a board divided into three equal parts, or throwing a dice with three numbers on it. An analogy with coin tossing (a two-way probability) is not correct.
- A 50 per cent ‘hit rate’ is substantially better than guesswork, and comparable with the skill level of the best overseas climate outlooks. See, for example, analysis of global outlooks issued by the International Research Institute for Climate and Society based in the US published in the Bulletin of the American Meteorological Society (Goddard, L., A. G. Barnston, and S. J. Mason, 2003: Evaluation of the IRI’s “net assessment” seasonal climate forecasts 1997–2001. Bull. Amer. Meteor. Soc., 84, 1761–1781).
- Each month, NIWA publishes an analysis of how well its outlooks perform. This is available online and is sent to about 3500 recipients of NIWA’s newsletters, including many farmers. See www.niwa.co.nz/our-science/climate/publications/all/cu
- All outlooks are for the three months as a whole. There will inevitably be wet and dry days, and hot and cold days, within a season. The exact range in temperature and rainfall within each of the three categories varies with location and season. However, as a guide, the “near average” or middle category for the temperature predictions includes deviations up to ±0.5°C for the long-term mean, whereas for rainfall the “near normal” category lies between approximately 80 per cent and 115 per cent of the long-term mean.
- The seasonal climate outlooks are an output of a scientific research programme, supplemented by NIWA’s Capability Funding. NIWA does not have a government contract to produce these outlooks.
Visit our media centre at: www.niwa.co.nz/news-publications/media-centre