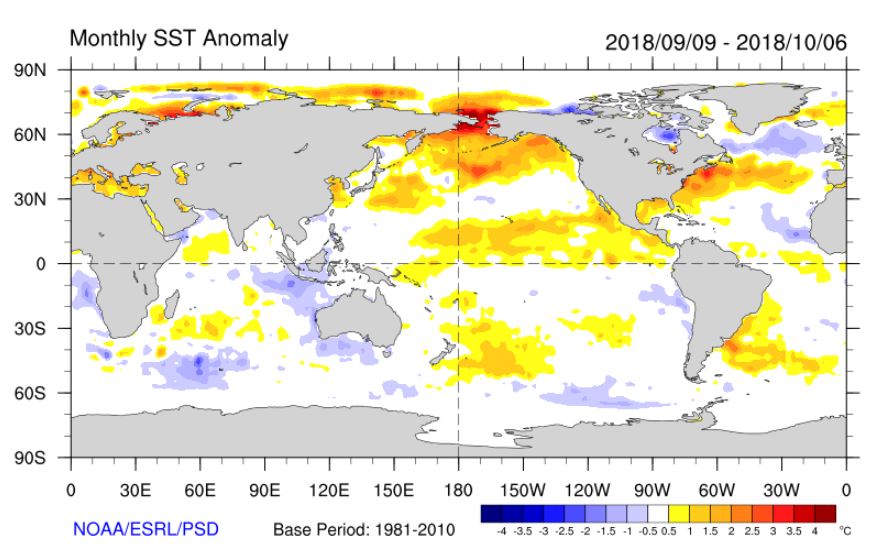
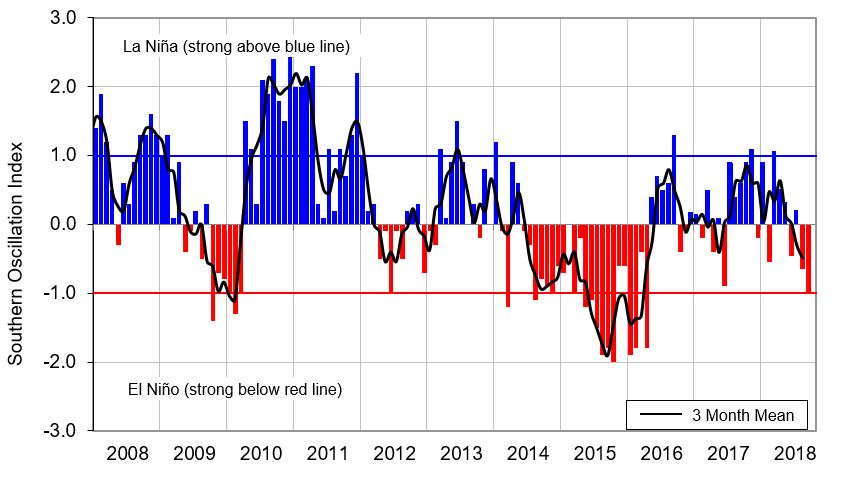
For the sixth consecutive month, ENSO-neutral conditions persisted across the tropical Pacific. In September 2018 however, the Southern Oscillation Index (SOI) continued to trend down and is now in the El Niño range with a value of –1. On the other hand, sea surface temperatures (SSTs) in the central and eastern equatorial Pacific remain in the neutral range: anomalies for the conventional NINO3.4 index remain just under the +0.3oC mark.
The consensus from international models is for the tropical Pacific to transition toward El Niño over the next three-month period (68% chance over October – December 2018). The probability for El Niño conditions being established remains high until autumn 2019, with a 71% chance for El Niño conditions over the April – June 2019 period. As was the case last month, most models forecast a rather weak event, characterised (at least initially) by maximum SST anomalies located in the central—rather than eastern—equatorial Pacific Ocean.
In other words, the upcoming El Niño event, should it come to fruition, is not expected to be of a similar intensity or type to what was experienced during 2015-16, 1997-98, or 1982-83.
Sea Surface Temperatures
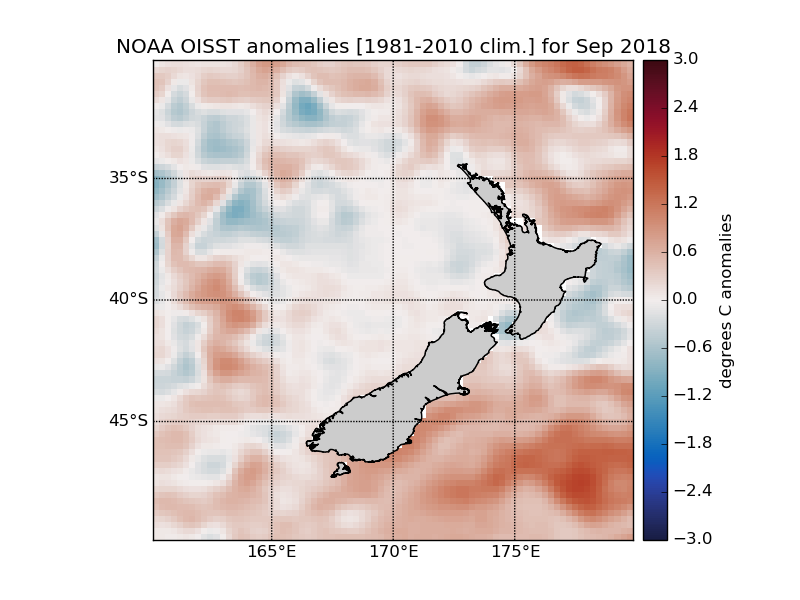
Near or below average SSTs are expected in New Zealand coastal waters during the next three months, which is generally consistent with +IOD events and weak El Niño conditions. The large area of positive SST anomalies offshore east and south of the country is forecast to persist.